Anthony Cecchini is the President of Information Technology Partners (ITP), an SAP consulting company headquartered in Pennsylvania. ITP offers comprehensive planning, resource allocation, implementation, upgrade, and training assistance to companies. Anthony has over 20 years of experience in SAP R/3 business process analysis and SAP systems integration. His areas of expertise include SAP NetWeaver integration; ALE development; RFC, BAPI, IDoc, Dialog, and Web Dynpro development; and customized Workflow development. You can reach him at [email protected].
Which SQL Database Accesses Cause the Highest Load?
Picking up from last month, we will look at how to use the ST05 Performance Trace Tool to solve performance issues. Remember you’ve ruled out deficiencies in the system setup, mishandling by users, or the need for parallel processing, then you need to revisit your code and see if the source of your performance problem is hiding there in your SQL commands.
Central to any database access performance analysis is an understanding of which accesses cause the highest load. It’s only logical that this is where you concentrate your efforts. In order to identify which tables are excessively accessed, Performance Trace enables you to aggregate all accesses by the names of the tables. By summing up all the request times, you can see which accesses to which database tables are causing the highest database loads.
For instance, I will use SE16 and read table MSEG with no key fields entered and use the ST05 trace to record the SQL. As you would expect this takes a minute. Her is the output of the display trace below. By following the menu path Trace List=>Summarize Trace by SQL Statement or hitting SHIFT+F8 you can see the summary.
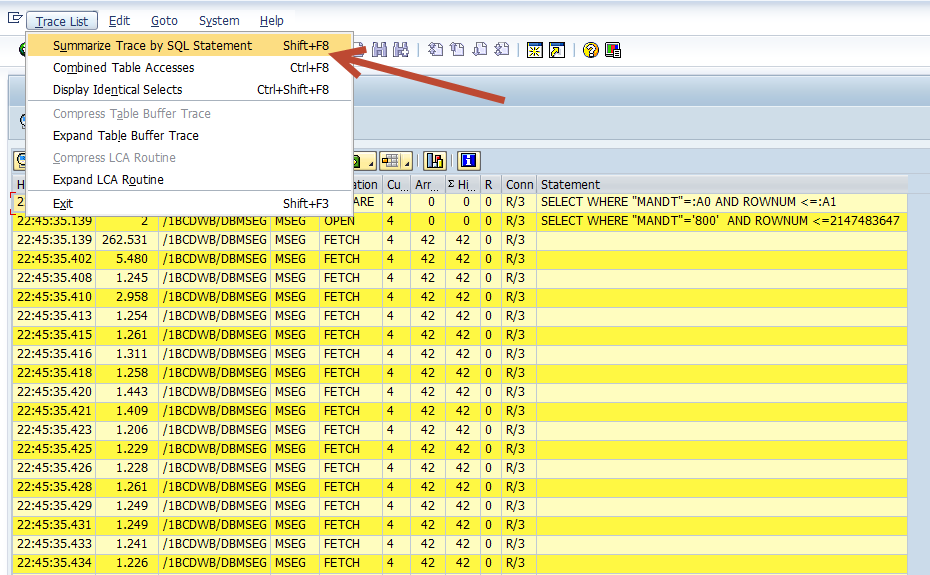
After activating the Summarize Function, you will see a list with the information aggregated for each table. The screen shot below displays a list that is already sorted by time to identify the database tables with the highest loads.
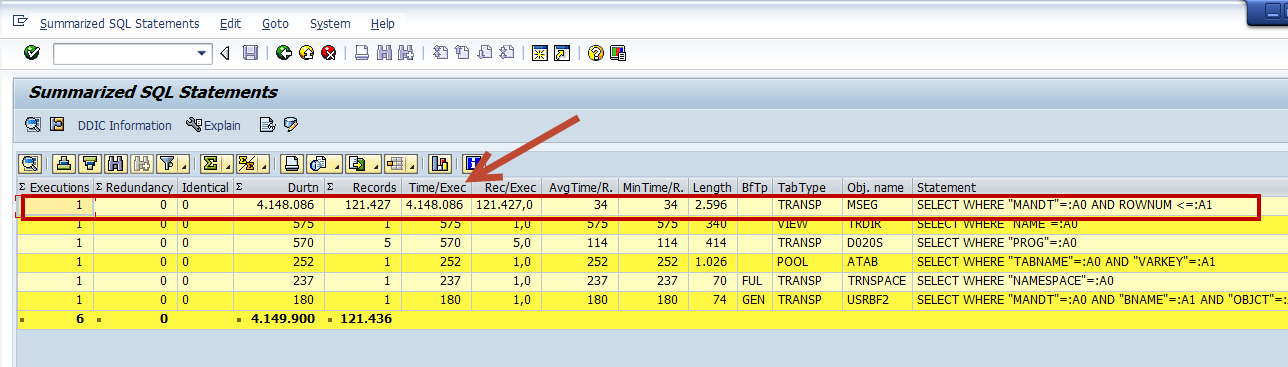
Obviously in our example the MSEG read was the highest. But in your trace, the high load might be caused by the number of accesses, the amount of read data, or by expensive SQL statements. Pick the highest loads, and focus on these first.
OK, then what?
Examine the “Execution Plan” Used by the Database
For each access, the Back-End Database determines the best way to handle the request, this is called an Execution Plan. There are two broad options for an Execution Plan when using SQL in your ABAP objetcs.
Perform a full table-space scan where the database simply reads all records from the table and then picks the ones that meet the conditions from the WHERE clause. Obviously, the higher the number of entries in the table, the longer this procedure takes.
Use an index that points directly to those records with specific value combinations for the index fields. This can substantially reduce the number of records to be read.
 If you are new to SQL and need a bit of level set, then here is a good way to think about this. Suppose you are reading a book on ABAP OO (Jeeezz…get a life!) and your looking for some good pointers on OPEN SQL and performance. Let’s also assume this version of the book you have you pirated and didn’t pay for so there is no index or table of contents! How would you find what you were looking for? You would have to scan each page looking for something to do with OPEN SQL and Performance, page by page, until you read every page in the book! This is what the database does when you select against a table without giving it a WHERE clause with a field in the primary, or secondary key, or worse yet NO WHERE CLAUSE. This is essentially a Table-Space Scan.
Now if had paid for your ABAP book, you would have the index and TOC (and no criminal record). Now, if you know the values you want to look up and go to the back of the book and use the index, you would get one or a few pages that are relevant to the topic saving you all that scanning! If you get one page back, this is like using the primary key of a table. Even if your search wan’t that specific like using the first 2 fields of the primary key of a table when there are 5 fields, you might get a few pages to look at. The time you need to find the right page is only marginally dependent on the total number of entries (i.e., the size of the database table). This is using an Index.
However, if you want to use the index but the data you have been given isn’t one of the fields in the index, this would result in doing a table-space scan because the entire table would need to scanned looking for the field. That said, you could create a secondary or Custom Index via SE11. This is normally done for very large tables and the back-end DBMS would use this index and NOT perform a full Table-Space Scan. A caveat is that you need to be careful creating too many custom indexes. Please keep in mind that while additional custom indexes will accelerate accesses, actions that modify the database table (e.g., INSERT, DELETE, UPDATE) will suffer performance degradation,since these actions require an update of all indexes.
Back to our regularly scheduled Blog…..
For each selection in the SQL trace, you can check the execution plan that is being used by the database. Simply place the cursor on the line containing the statement in question and then select the ![]() button, or use the menu path Trace =>Explain SQL, or hit F9. (see below)
button, or use the menu path Trace =>Explain SQL, or hit F9. (see below)
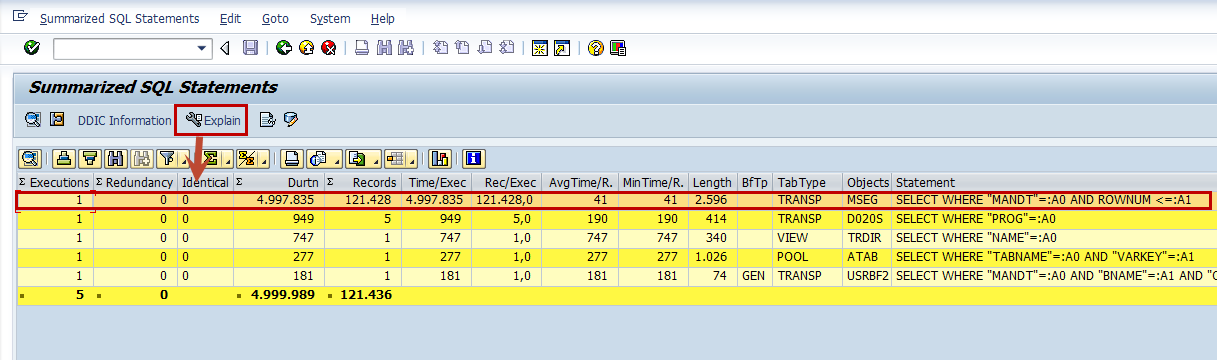
The look of the next screen is heavily dependent on the specific database you use, so there are several different possibilities for the display you might see. In general, you will see the statement as it was handed over to the database and the execution plan (note that for some databases, you might have to activate another button to see the execution plan). Then you can decide whether or not the selected execution plan is acceptable.
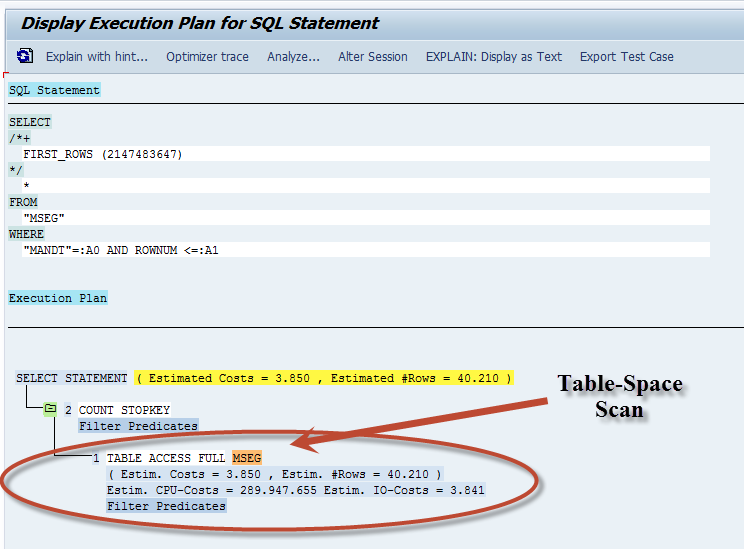
So in our example where we used SE16 wide open on MSEG, we would expect to see a Table-Space Scan or theentire table being read. And this is what we see in the Execution Plan Below.
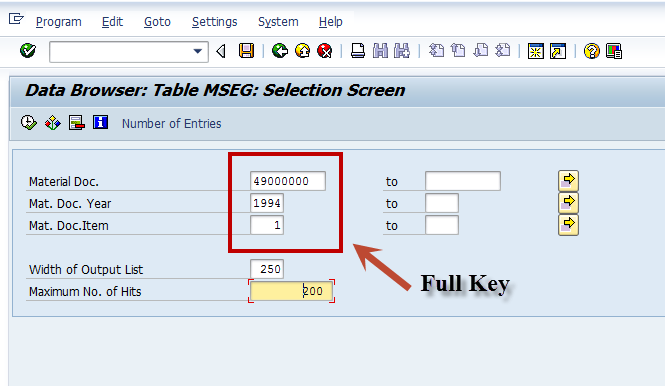
OK, lets change this up a bit and use the full key of Material Doc#, Year and Item and trace the select again in SE16. (see below)
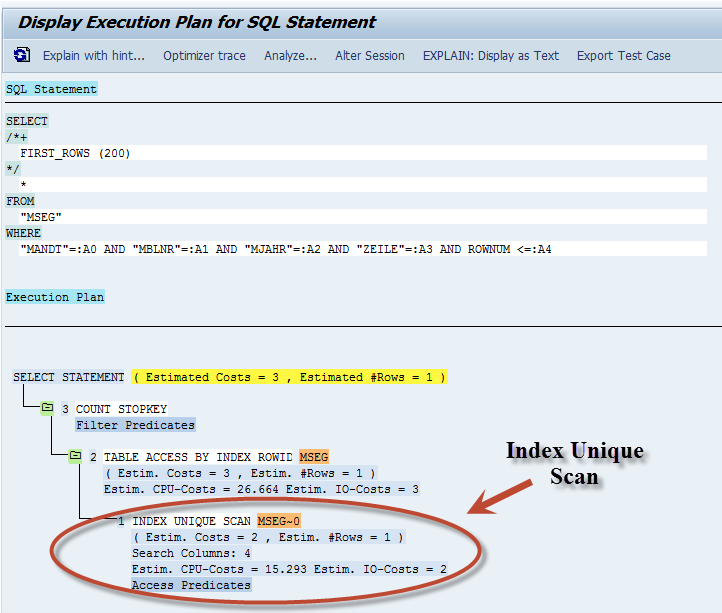
Lets look at the EXPLAIN of the Execution Plan below. What you see is an Index Unique Scan, which means that all index fields were specified with “=” in the WHERE clause. This of course is very fast, as you see by the cost. The cost of this was 2 vs. the cost of the Table-Space Scan above which was 3,850.
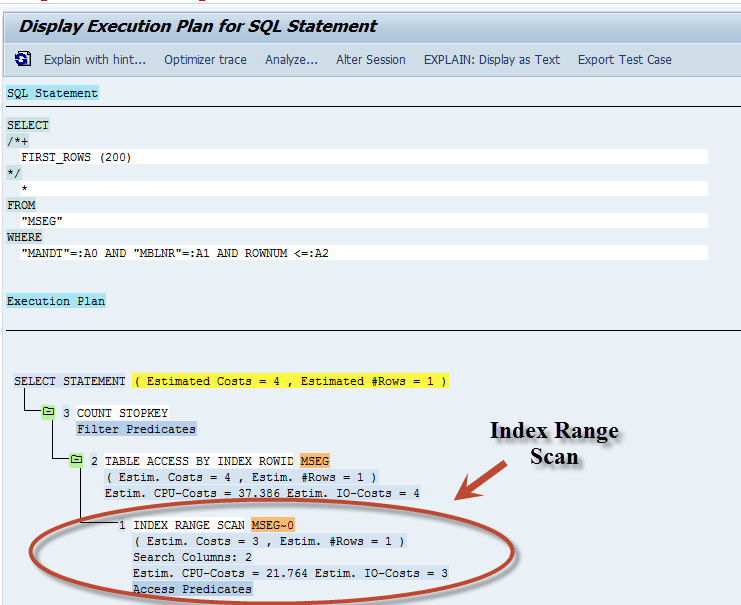
What do think would happen if we used a partial key? Say just the Material Doc# without the year or item? If you guessed we would still use an Index, YOU WERE RIGHT! However, because it wasn’t the FULL KEY, we would require the database to read several index entries to determine the result set. This is called an Index Range Scan and looks like the screen shot below. Please note the cost is only slightly higher than the Index Unique Scan.
The execution plan also tells you how the database handles a selection using a JOIN command. A JOIN is used to access combined information from multiple tables. When using a JOIN, you must consider the way the database reads and uses the information from these tables. Usually you expect the database to perform a “nested” JOIN, which means that the database first reads the information from one table according to the restrictions in the WHERE clause, starting with the table with the “best” restriction. Then using the result set, and considering the JOIN condition, the next table is accessed to read further data, and so on. In this way, the number of records to be read from the different tables should progressively decrease.
However the database might decide to use a “merge” JOIN, where the records from the affected tables are read independently and only restrictions in the WHERE clause are considered. then in a second step, the result sets are merged according to the JOIN condition. Obviously, this can cause very long runtimes, especially if large tables are affected that have no suitable index available. In such a case, it may be beneficial to replace the JOIN statement by two or more selections on each table, using the FOR ALL ENTRIES clause to emulate the nested JOIN. You can also use this trick if the database uses a nested JOIN but starts with the wrong table.
Conclusion
In my work with SAP, I have found a number of common performance pitfalls. Sometimes there is a weak design, which sometimes makes a correction quite expensive — a widespread modification of the program would be necessary instead of only a local optimization. Other times the extended runtime is simply caused by the way functionality was implemented — i.e., not all relevant performance aspects were considered at the start.
Whatever the cause of your program’s performance troubles, optimizing the runtime of the application requires that you first find out where the major part of the runtime is spent. In this effort the ST05 Performance Trace can help optimize your SQL. This in conjunction with other tools like SAT, Code Inspector, and other Static Checks will go a long way in helping you develop quality ABAP code in your career.
Don’t forget to take a look at ABAP Database SQL Analysis Using The Performance Trace – Part 1 for and understanding of the SQL Trace tool look and feel .
Below are some videos that help explain SQL and Optimization
References:
Query optimization – Wikipedia, the free encyclopedia
[edit]. A SQL query to a modern relational DBMS does more than just selections and joins. In particular …