 Anthony Cecchini is the President of Information Technology Partners (ITP), an SAP consulting company headquartered in Pennsylvania. ITP offers comprehensive planning, resource allocation, implementation, upgrade, and training assistance to companies. Anthony has over 17 years of experience in SAP R/3 business process analysis and SAP systems integration. His areas of expertise include SAP NetWeaver integration; ALE development; RFC, BAPI, IDoc, Dialog, and Web Dynpro development; and customized Workflow development. You can reach him at [email protected].
Performance Problems Come in a Variety of Flavors
There are many reasons for slow execution of a transaction or a report. Sometimes there are general system problems. Sometimes users use the program in a way it was not designed for. Sometimes the nature of the application and workload calls for parallel processing. And sometimes the source of the performance issue can be traced back to your ABAP code, mainly the construction of your OPEN SQL Definition.
While there are many reasons other than database performance that could be causing the performance problem, this blog series will focus on just this aspect. If you’ve ruled out deficiencies in the system setup, mishandling by users, or the need for parallel processing, then you need to revisit your code and see if the source of your performance problem is hiding there in your SQL commands.
Lets agree now that all programs perform numerous accesses to the database, so this should be considered thoroughly. For example, selections that are not supported by a suitable index can have long (very long!) runtimes. This not only potentially impacts the running programs themselves, but is also an encumbrance to all users, as they have only limited access to the database if it is blocked by some long-running selections.
Analyzing Database Access Activities with Performance Trace
If you found (or have assumed) that the long runtime is caused by database accesses, use the Performance Trace tool (transaction ST05) for further analysis. With Performance Trace you can record all accesses to the database coming from the instance.
As you can see in the steps below, you typically start the trace in one session (1), start the program you want to test in another session (2), switch off the trace after the end of the program (3), and then analyze the recorded data (4).
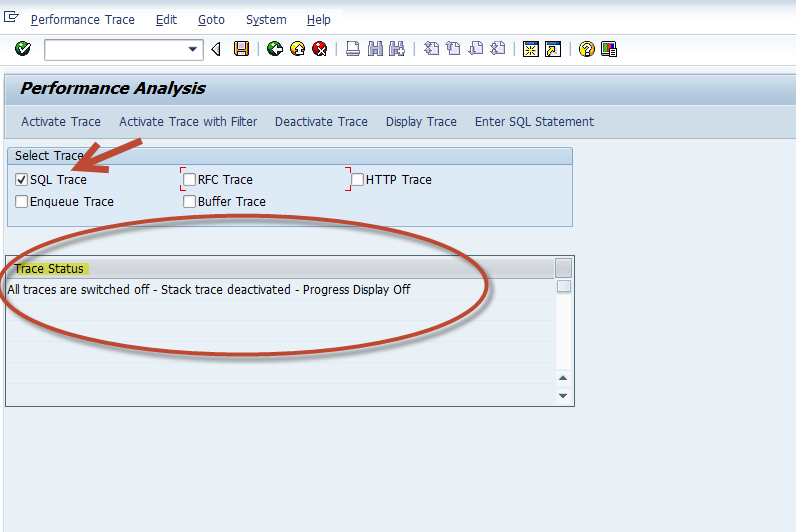
Let’s take a look at the start screen of the Performance Trace tool. Before we examine the details of using this tool, it is important to note the following considerations:
– Performance Trace records only the information coming from the work processes on the same instance. Consequently, if you are using Remote Function Calls (RFCs) or asynchronous updates in your program, the database accesses from these modules will not be recorded if they are executed on other instances.
– Performance Trace can be used by only one user at a time on each instance. Before using the trace, please make sure that it is currently switched off and not already in use. You can see this by the “Trace Status“ at the bottom of the start screen.
– The trace information is written to a file of a fixed size. If the size limit of the file is reached, the oldest data is overwritten. Therefore, it is possible that the trace information of a long running program will be incomplete and you will only see the most recent data. Data from older traces remain in the trace file only until the space is required for new trace information.
As you can see in the screen shot above, there are five different trace modes for the performance trace:
SQL Trace covers all database accesses.
Enqueue trace covers all enqueue operations.
RFC Trace covers all RFC communications from and to the instance
Buffer trace covers all accesses to the table buffers on the instance.
HTTP Trace covers response time end to end, time spent for execution on the server, Bytes sent and recieved, and time for data transfer both sent and received. (e.g. If you were connected via CITRIX and wanted to trace)
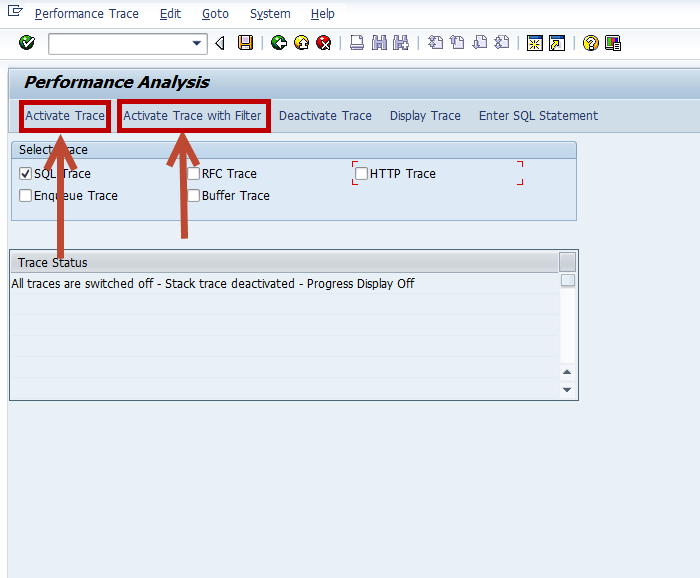
For the analysis of database accesses, it is sufficient to activate just the SQL trace. The enqueue, RFC, and buffer traces are useful for a performance analysis if you know (or suspect) that enqueue requests, RFCs, or accesses to the table buffers are taking more time than they should. When you start the trace, you can select whether or not you want to record data from all programs running under your user name on the instance (Activate Trace button) or if you want to define some filters (Activate Trace with filter button).
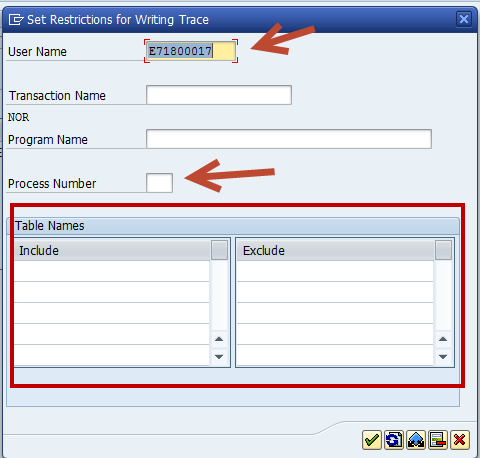
The screen shot below shows your options for narrowing the data to be traced. You can select data from programs running under another user’s name, select or exclude certain tables, restrict the data to a specific work process (e.g., if you start the trace when the program is already running), etc…
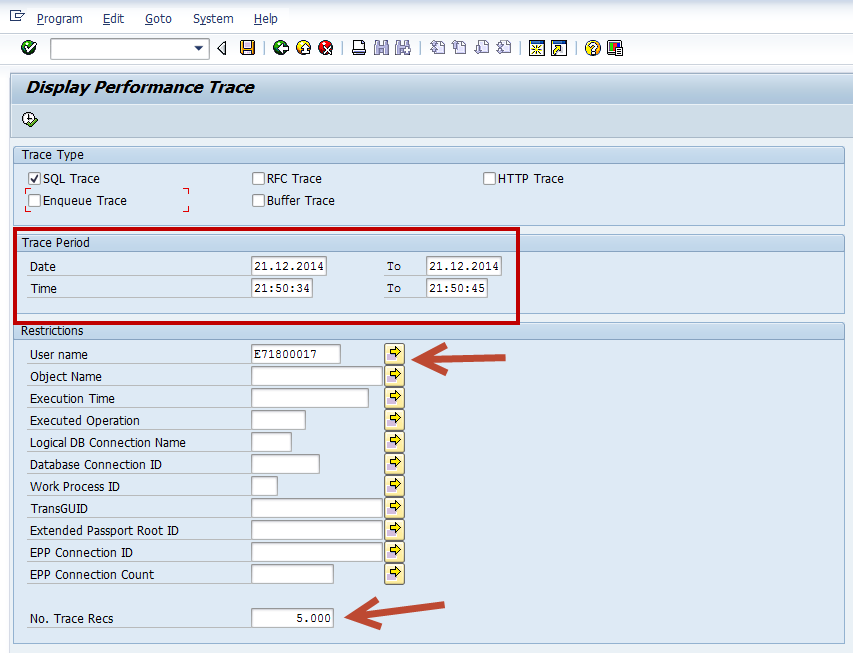
By pressing the Deactivate Trace button in the start screen of ST05 the trace is stopped. With Display Trace, your options for filtering the data to be displayed is shown. You can select the type of information to be displayed (SQL, enqueue, RFC, buffer); you can specify the time period in which the data was recorded (by default it is the period of the last recorded trace); you can select the name of the user whose data should be displayed; and you can select the tables you want to see (or not see). You can select the number of trace records to display (default is usually 5,000). There are many restrictions you can enforce besides the ones I am describing. Please consult the SAP help.
Now with a click of the green check ![]() we see the results below.
we see the results below.
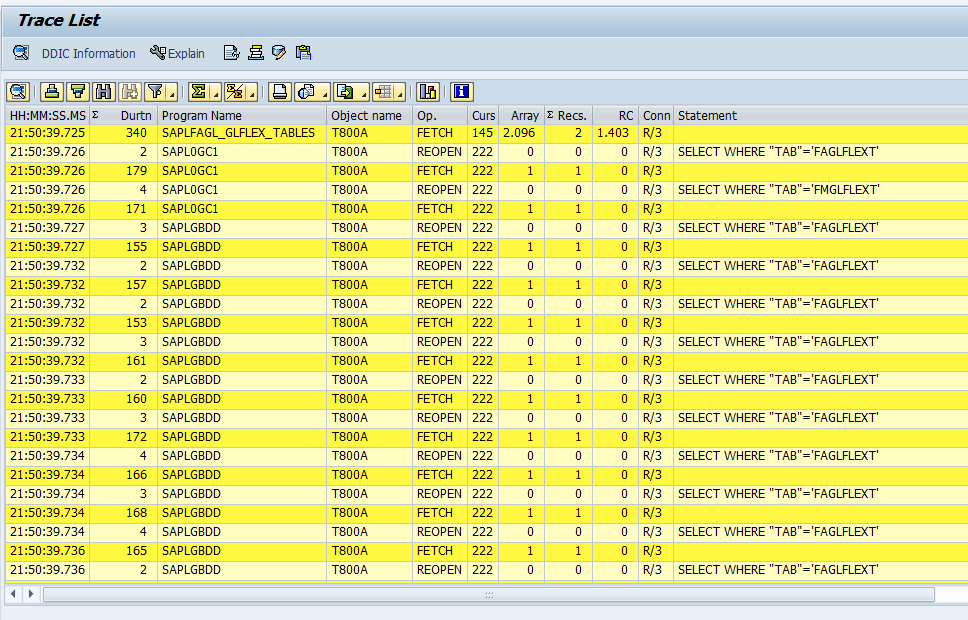
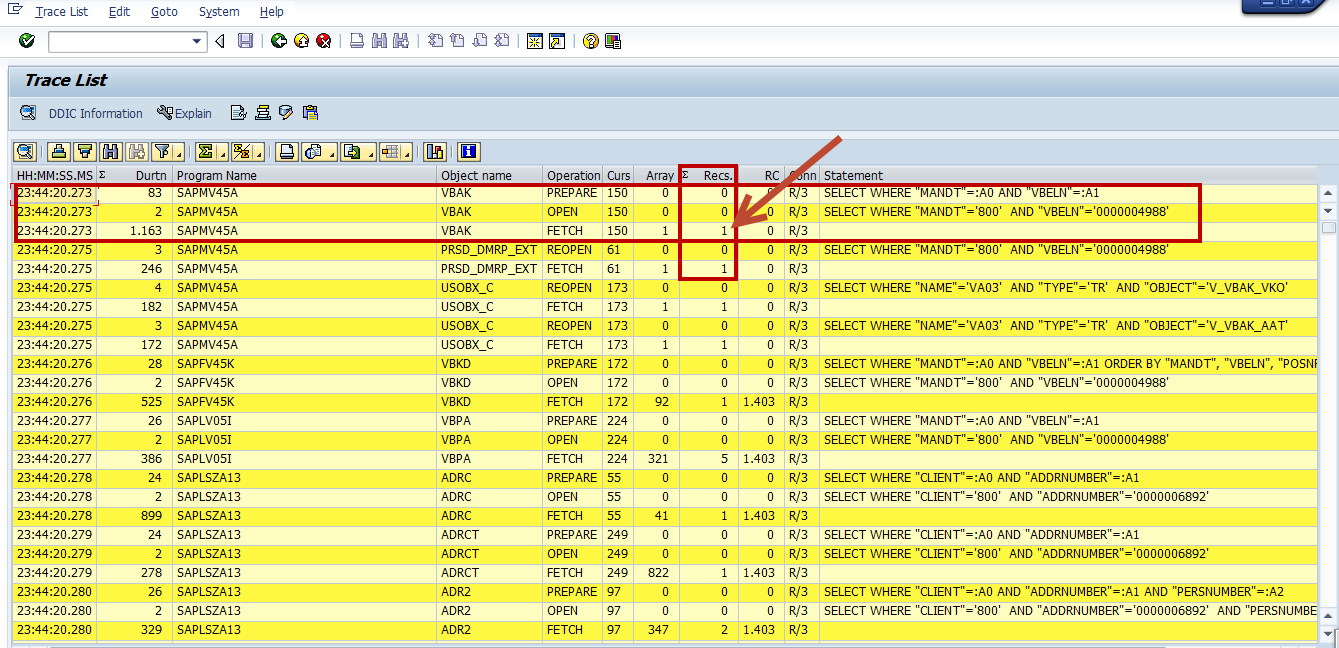
Let’s take a look at how to interpret all of this performance data. The columns shown (from left to right) have the following meanings and the items highlighted in red, are the most important when discussing performance.
HH:MM:SS.MS — The time at which the operation was executed
Duration — The duration of the operation
Program — The name of the ABAP program
ObjectName — The name of the affected table
Op. — The database operation
Curs — The used cursor
Array — The number of records that can be transferred in one step from the database
Recs — The number of records that were read or sent to the database (e.g., when inserting data)
RC — The return code from the database
Conn — The name of the database connection
Statement — The statement as it arrives at the database
Sometimes the line that indicates the duration of the operation is shaded in red, which means that the duration time exceeds 100 ms. Please understand that this does not necessarily mean there is a performance problem with this access, as you always have to take the number of processed records into consideration for context. For example, reading 1,000 records in 200 ms is a good result, but reading only 5 records in 80 ms is not very good. That said, in the above case, where the duration time is high although the response time per record is not, you should still check whether this high number of records is really required — perhaps you do not really all these records returned and can reduce the result set returned, thus boosting performance as well.
As a rule of thumb, a processing time of up to 2-5 ms per record is okay, and thus need not be a major concern to you at this time, even if it can be potentially be faster.
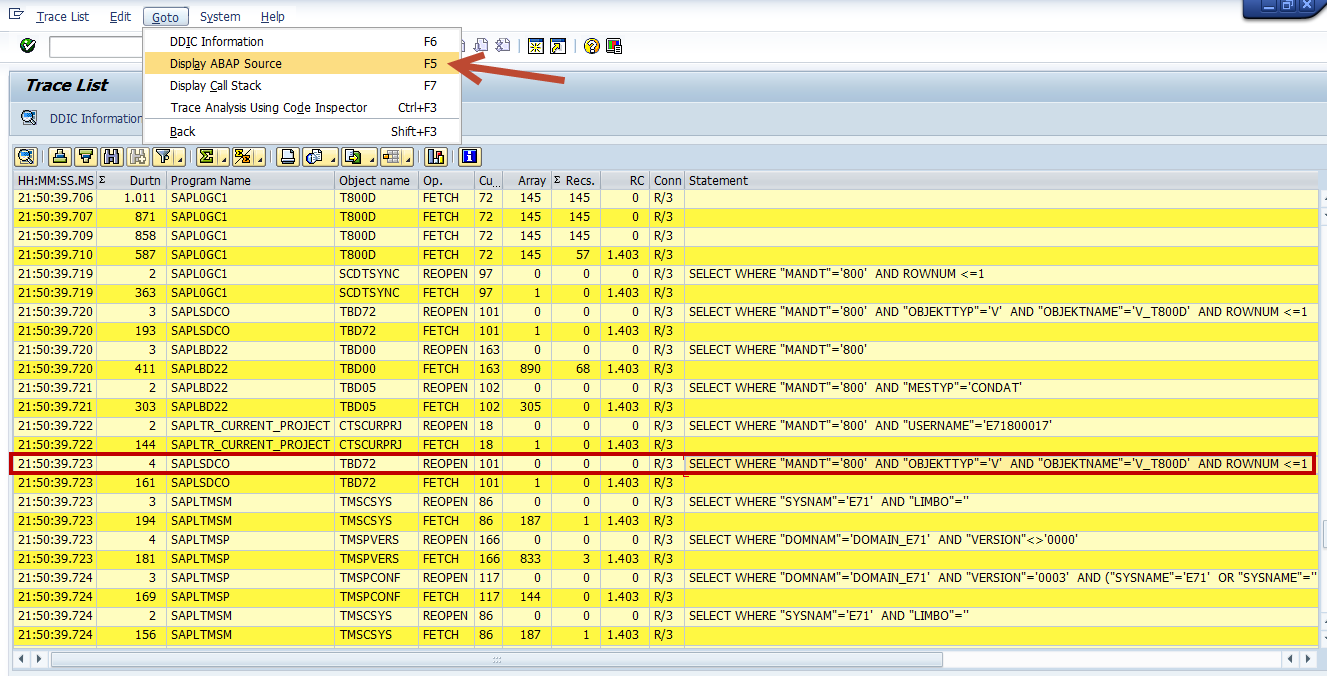
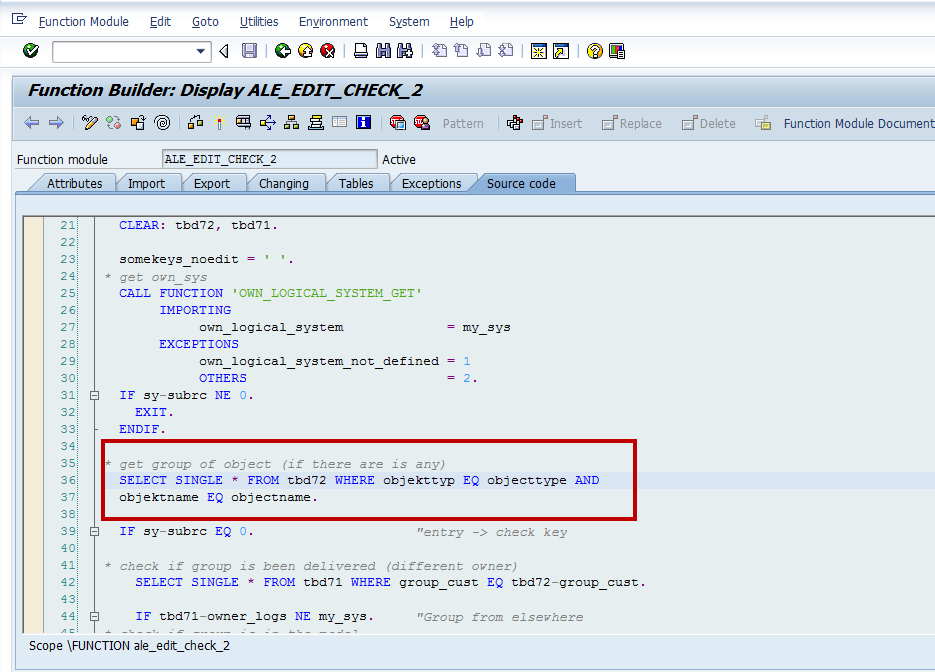
In the column Program, you see the name of the ABAP program where the access was coming from. In order to navigate to the code belonging to it, place the cursor on the line with the statement in question and select the ABAP display button ![]() or use the menu path Goto → Display ABAP Source, or even hit F5 key.
or use the menu path Goto → Display ABAP Source, or even hit F5 key.
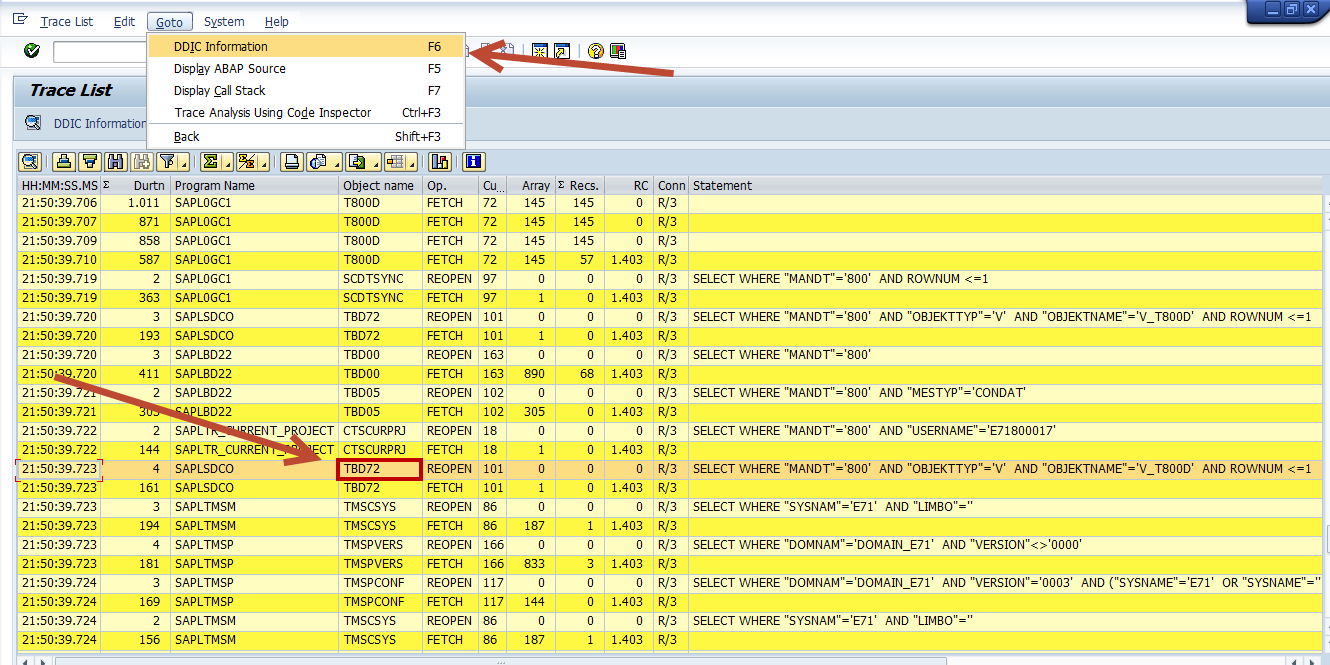
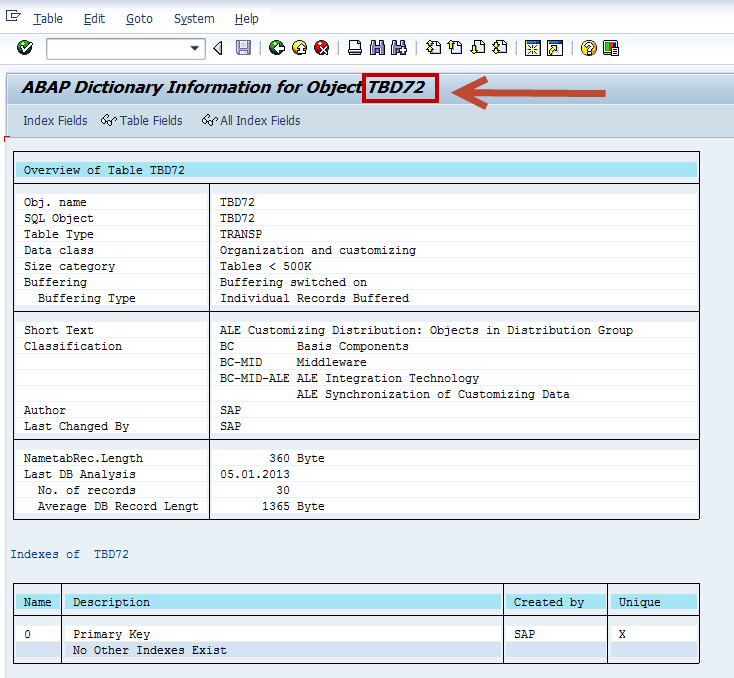
The column ObjectName contains the name of the database table affected. If you want to see some information from the DDIC (the Data dictionary) for a particular table, place the cursor on a line containing that table and select the DDIC info button ![]() , or use the menu path Goto →DDIC information, or hit F6 key.
, or use the menu path Goto →DDIC information, or hit F6 key.
The column Rec tells you how many database records were read and transferred to the application server in one step (FETCH operation). Sometimes the result of the query consists of more records than can be transferred in one step. In this case, you would see several lines with repeated FETCH operations. In the example below, you can see I was executing a VA03 (Sales Order Display) for S/O # 4988. You would expect to see a REC of 1 and we do, as this Sales Order does exist.
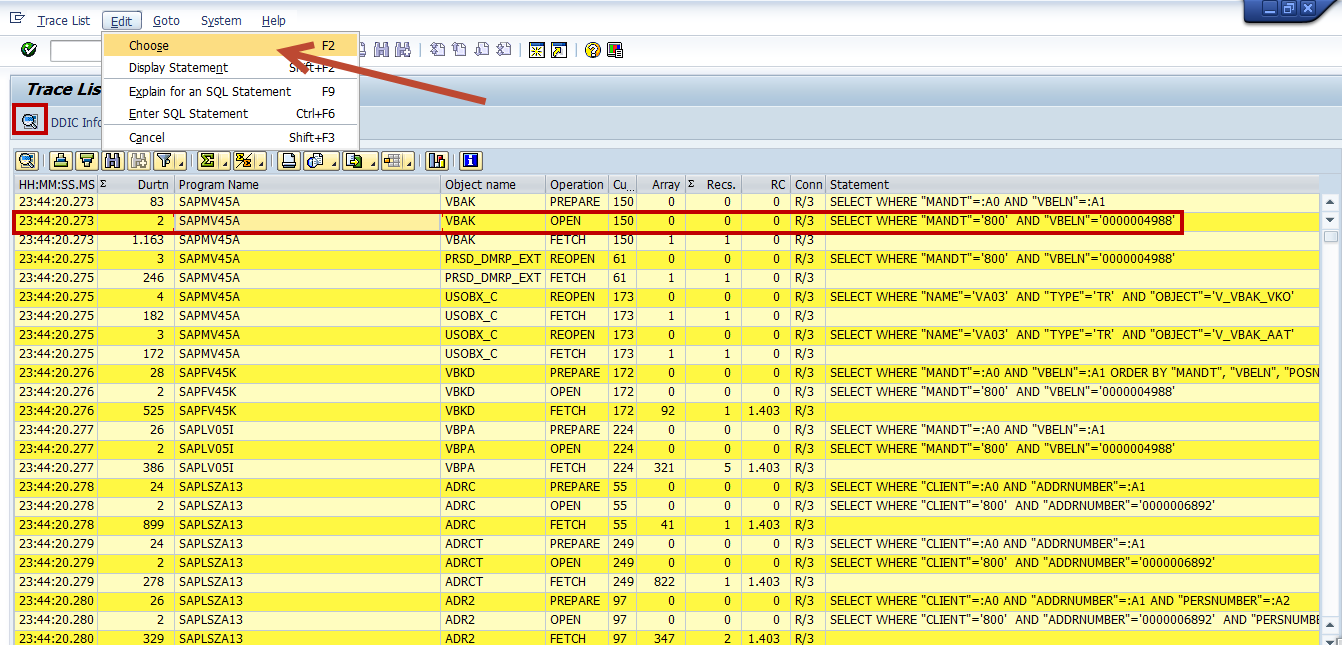
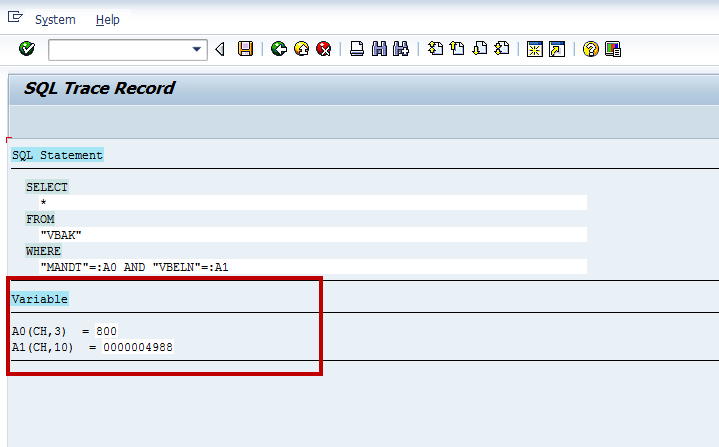
In the final column (Statement) you see the statement as it was handed over to the database. This usually looks a little different from the original ABAP statement because it was transformed by the Open SQL layer on the instance. The complete statement is displayed when you place the cursor on the line with the statement in question and select the details button , or follow the menu path Edit → Choose, or hit the F2 key. At the bottom of the statement you can see the values that were used for each variable in the WHERE statement, as well as their data type and length within the parenthesis (e.g CH, 3 is data type CHAR and a length of 3).
Summary and what’s next…
OK, we learned about the Database Performance Trace. We learned how to execute it via the transaction ST05, and the normal sequence of events when taking a trace snapshot. We saw how to filter what we wanted to trace, as well as filter the display once a trace has been taken. We also took a deep dive into the Trace results, learned about the columns and some nice shortcuts into the code, DDIC information, and SQL statement passed to the back-end DBMS. In the next Blog, we dig in and see how to find a performance issue with this trace tool.


