 Anthony Cecchini is the President of Information Technology Partners (ITP), an SAP consulting company headquartered in Pennsylvania. ITP offers comprehensive planning, resource allocation, implementation, upgrade, and training assistance to companies. Anthony has over 17 years of experience in SAP R/3 business process analysis and SAP systems integration. His areas of expertise include SAP NetWeaver integration; ALE development; RFC, BAPI, IDoc, Dialog, and Web Dynpro development; and customized Workflow development. You can reach him at [email protected].
The New ABAP Debugger USER Interface
The New ABAP Debugger provides a state-of-the-art user interface that can be customized to your needs.
Before exploring how the New ABAP Debugger user interface can help you achieve greater productivity, let’s focus on the following ……
• What are the main parts of the New ABAP Debugger user interface?
• How can I customize the ABAP Debugger User Interface?
• Which ABAP debugger tools are available through the user interface?
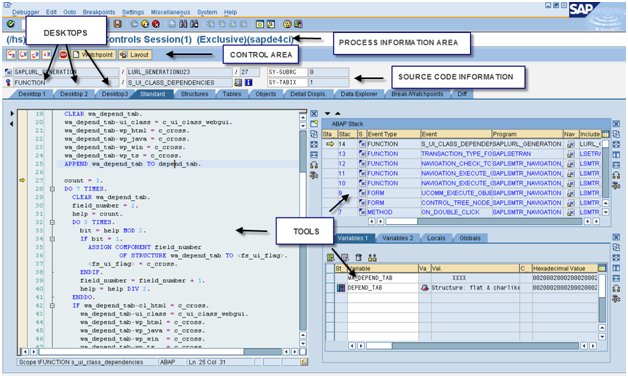
Let’s look at the new ABAP Debugger interface. See below.

There are five main components of the New ABAP Debugger user interface:
• Process information area
• Control area
• Source code information area
• Desktops
• Tools
Let’s take a look at each in turn.
Process information area: The process information (or title) area of the ABAP debugger user interface provides information about the status of the debugger or debuggee. The following information is provided:
– Session number: Because you can debug several applications in parallel, you need to know which session the ABAP debugger user interface is connected to.
– Debug setting/session type: Next in the process information area is information about the session type or status:
(/hs) indicates that system debugging is active.
-HTTP- indicates HTTP debugging.
-RFC->destination indicates debugging of an RFC module at the specified destination.
-UPDATE- indicates debugging of the asynchronous update functionality of a transaction.
-ATTACHED- indicates that the debugger is attached to a process (you can attach the debugger to a running process via transaction SM50 by following the menu path Process–>Debugging.
– Exclusive/Non-Exclusive indicates whether the ABAP debugger session runs as an exclusive session or a non-exclusive session. In an exclusive debugging session, the work process is exclusively locked for your currently running debugging session; in a non-exclusive debugging session, the work process is not locked, and any debugger action may involve an implicit database commit during roll-in/roll-out of the debuggee context. (See July 2011 Q&A in Newsletter)
Control area: Standard features for execution control (step into, step over, return, continue) in the New ABAP Debugger are similar to those in the Classic ABAP Debugger. The new debugger also provides shortcuts to create breakpoints and watchpoints.
Source code information area: The New ABAP Debugger displays the full information about the current source position. The displayed information depends on the current code type — in ABAP code you see “main program,” “include,” and “source line” information; in screen flow code, you see “main program,” “screen number,” and “source line” information.
Desktops and tools: Finally, we reach the most important part of the New ABAP Debugger user interface — the desktops and tools. The desktops are your work areas, and all available tools (e.g.,the Source Code display tool and the Variable Fast Display and can be arranged on the desktops. You can configure the desktops to your needs and switch to specialized desktops for unique debugging tasks. As you can see, there are three user-specific desktops (Desktop 1, Desktop 2, and Desktop 3) and seven standard desktops (Standard, Structures, Tables, Objects, etc.). You can customize which tools appear on any desktop (with a maximum of four tools on a desktop), along with the position and size of the tools on the desktop, but only the configuration of the three user-specific desktops can be stored permanently in a debugger variant. That right, we now have debugger variants. A debugger variant can consist of Options (e.g., customizing the navigation to the Detail Views or special options for the different tools) and debugger settings (e.g., turn the system debugging on or off ). You can store your Breakpoints and any user interface customizations (e.g., which tools are located on which desktop). Debugger variants are stored on the database. To access them, you need the name of user who created the variants and the variant name. You can also download a debugger variant to a local file. Cool…huh?
Customizing the New ABAP Debugger User Interface
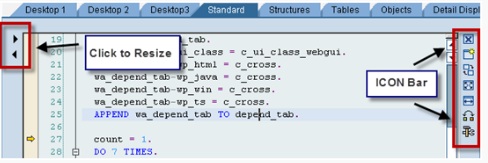
Ok, let’s wrap this up with customizing the interface. Below you see a debugger tool (the Source Code display tool) residing on a desktop. It is automatically accompanied on the left by arrow symbols, which you can use to resize the tool, decreasing or increasing the size of the area it covers in the window. On the right side is an icon bar, which provides the following functionality:
• Close (or remove) the tool.
• Choose a tool from the pop-up dialog, and add it to the current desktop.
• Exchange the tool with another tool selected from the pop-up dialog.
• Set the size of the tool to full-screen mode (this hides all other tools – be careful)
• Swap the location of one tool with that of another tool.
• Invoke a tool-specific services dialog.
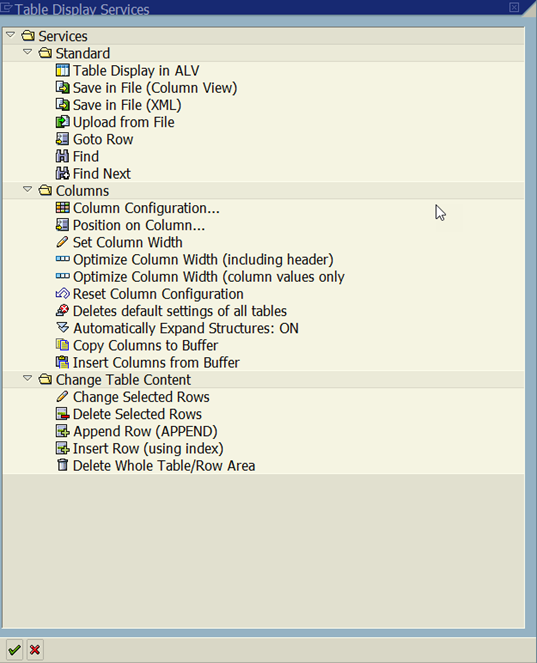
When you invoke a tool-specific services dialog, a services dialog pop up that is specific to the tool in use opens. Let’s use the Tables tool as an example. (see below)
The services dialog consists of two sections:
Standard: Standard services are available for almost all tools. You can download the current tool content — for example, you can download the content of an internal table to a local file in order to analyze it by sorting the data, for example, in Microsoft Excel. You can also perform searches in the displayed content of the tool (press Ctrl-F to start a search and Ctrl-G to continue a search) — you could search for a special attribute of an object in the Object View.
Tool-Specific: This portion of the dialog presents all the specific features of the selected tool. As shown in the table-specific services dialog above, there are tools for customizing the columns and for modifying the content of an internal table (e.g., changing or inserting a row). You even have the option to delete the table itself.
Final Thoughts……
Now you know how easy it is to customize your debugger desktops by adding (or removing) any of the Tools, and how easy it is to arrange them on the desktops.
In the next part of this Blog series on The New ABAP Debugger, I will dive into each of the tools.
If you want to read the first part of this Blog series on the ABAP Debugger, click The New ABAP Debugger – Part 1


