 Anthony Cecchini is the President of Information Technology Partners (ITP), an SAP consulting company headquartered in Pennsylvania. ITP offers comprehensive planning, resource allocation, implementation, upgrade, and training assistance to companies. Anthony has over 17 years of experience in SAP R/3 business process analysis and SAP systems integration. His areas of expertise include SAP NetWeaver integration; ALE development; RFC, BAPI, IDoc, Dialog, and Web Dynpro development; and customized Workflow development. You can reach him at [email protected]
Tools of The NEW ABAP Debugger
In this, the 3rd and the final installment, I will explore the tools of the NEW ABAP Debugger somewhat in depth. I will explore the tools I feel you will most likely use repeatedly. Please consult theSAP help portal for the New ABAP Debugger to explore any tool further, and learn about any not discussed directly in this blog.
The tools of the New ABAP Debugger are optimized for the different debugging situations you may have to deal with during the course of solving a problem. Some of the tools you will recognize from the Classic ABAP Debugger; others are brand new. Before we look at a few of the tools and how to use them, lets first get comfortable with the tools menu and how the tools are organized.
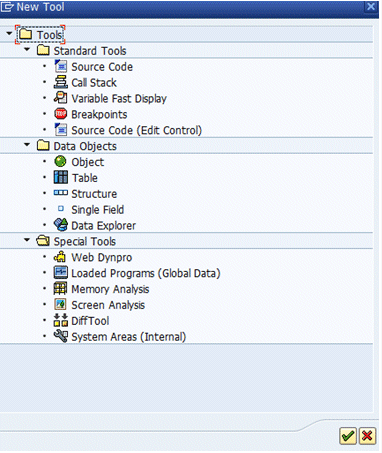
If you want to add a new tool to the current desktop, you will get the pop-up window titled “New Tool” where you can choose the appropriate tool based on your situation.
The New ABAP Debugger – Tool Sections
The tools are grouped into sections:
Standard Tools:
– Source Code: Display current source code in the back-end editor. Please note that this is the old editor and I recommend you do not use this. There is another tool farther down the menu that will use the NEW Editor
– Call Stack: Display the current ABAP stack and screen stacks.
– Variable Fast Display: Display variable value and type.
– Breakpoints: Maintain breakpoints, watchpoints, and checkpoints.
– Source Code (Edit Control): Display current source code in the NEW ABAP Front-End Editor. This is the option I recommend you use to enlist all the valuable enhancements of the new editor.
Data Objects:
– Object: Display/change objects and classes.
– Table: Display/change internal tables.
– Structure: Display/change structures.
– Single Field: Display/change variables with simple data types, such as C, N, D, T,STRING,… etc.
– Data Explorer: Display very complex data structures in a tree-like fashion.
Its worth mentioning, that if you double-click on a variable displayed in any tool, you will launch the corresponding detail view described above that corresponds to its data type.
Special Tools:
– Web Dynpro: The structure of the content of the current controller, the properties of the UI elements in the layout of the current view and the currently instantiated component usages
– Loaded Programs (Global Data): Display all currently loaded programs and their global variables.
– Memory Analysis: Display integrated Memory Inspector tool (S_MEMORY_INSPECTOR)
– Screen Analysis: Display the screen attributes and the subscreen stack.
– Diff Tool: Compare variables very quickly to outline delta
– System Areas (Internal): Display system areas such as SMEM, ABAP Memory, Datasets, Screen Attributes…etc
OK, lets take a closer look at the most common debugging activities — displaying source code and the call stack, analyzing variables, and setting breakpoints and watchpoints.
Displaying ABAP Source code
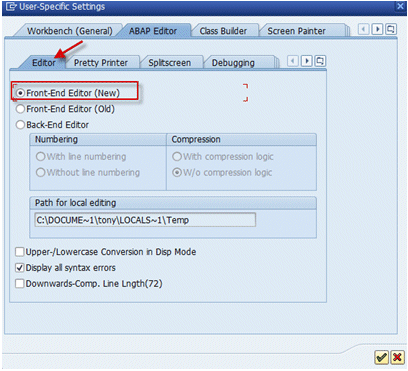
I believe it’s important that we are using the New Editor and not the old “Classic Editor”. To be sure you are using the new editor, from the ABAP Editor main screen (SE38 or SE80) follow the menu path Utilities–>Settings. Verify that you are positioned on the editor tab and have selected the radio button for the Front-End Editor (New).
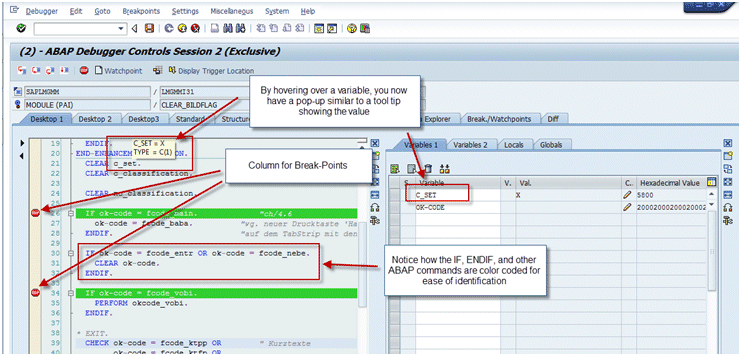
There are several compelling reasons for doing this (look for an upcoming Blog on the New SAP Editor), the reason most relevant for this blog is that the New ABAP Debugger leverages the following benefits of the new ABAP Front-End Editor…
– ABAP code is easy to read because of real-time syntax coloring.
– Both vertical and horizontal free scrolling is possible.
– Processing block start and end (i.e., IF/ENDIF,LOOP/ENDLOOP) is highlighted in real time.
– Variable values and types appear in a Data Quick Info pop-up.
– Breakpoints are easily set using a breakpoint column
Displaying the ABAP CALL Stack in The New ABAP Debugger
The Call Stack tool displays the ABAP call stack. It allows you to switch to the context of each stack level and navigate to the source code by opening the ABAP Editor, in order to start a deeper analysis of the code in a separate window(just double click!). Also new with SAP NetWeaver 2004s is the ability to display the screen (Dynpro) stack as well. Even more important, you can display a combined ABAP and screen stack to find out on which ABAP level which screen was called, and which screen invoked which ABAP module.
You can navigate from each stack line to the corresponding source line in the editor by double clicking on the icon in the stack type column.
Displaying variable contents
One of the new features of the New ABAP Debugger is the Variable Fast Display tool, which enables you to view basic information about a variable, such as the variable type, value, hexadecimal value, etc.
To display this information, you select the tool and then type in the variable name, or you can double-click on the variable name (i.e., the symbol) in the source code to transfer the symbol to the Variable Fast Display.
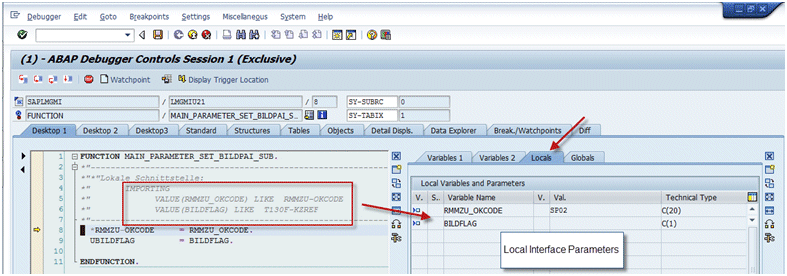
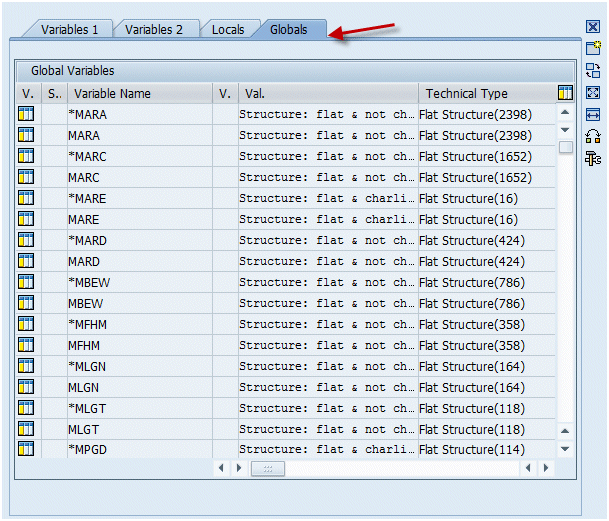
Even more convenient is the ability to display all global variables of the current program or all local variables (including the interface parameters) of the current procedure.
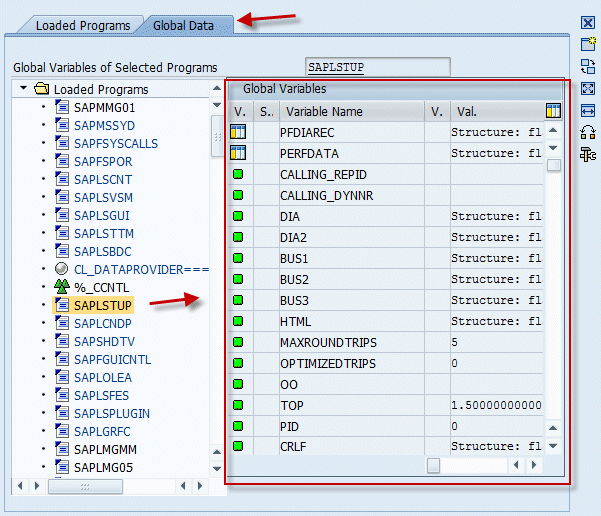
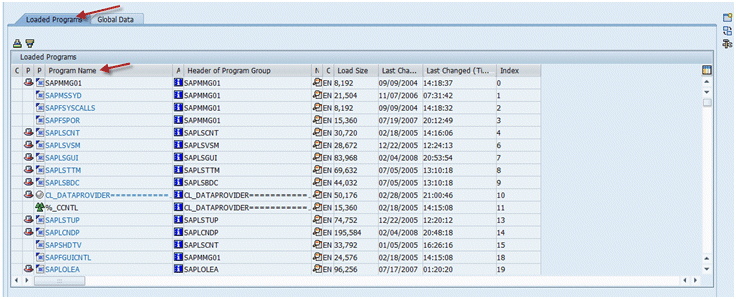
If you are interested in a special global variable of another program that is part of the application, you can use the Loaded Programs (Global Data) tool belonging to the special tools category, which allows you to browse all global variables of all loaded programs, not just the current program.
This tool also allows you to check out which programs have been used (i.e., loaded) in the current internal session.
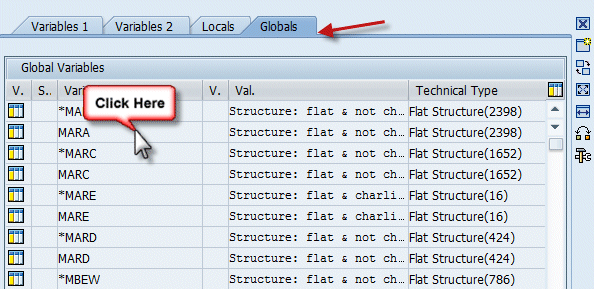
One of the most significant benefits of the New ABAP Debugger is the ability to provide tailored detail views for all ABAP data types. The detail views are part of the New ABAP Debugger navigation system. Regardless of the tool that is active, you can navigate to a detail view by simply double-clicking on the variable in any tool (with the exception of the Source Code tool), and the variable automatically appears in the appropriate detail view.
For example, if we go back to the above diagram for global variables for the current program and double-click on line 2 of the MARA structure, the tool displays the Structure of MARA at the discrete field level.
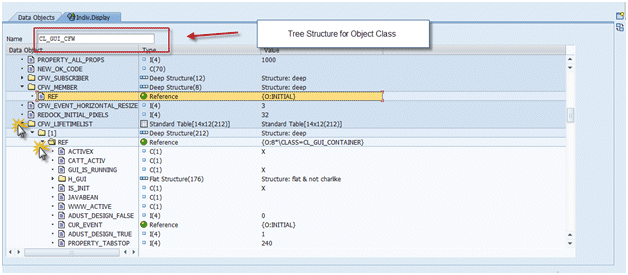
For very complicated data structures, such as a complex nested object, it is more convenient to start an analysis in a tree-like display that allows you to dig deeper and deeper into the object without losing information about the levels above. The Data Explorer tool provides this capability.
Break-Points and Watch-Points in The New ABAP Debugger
While breakpoints have not changed much between the Classic and New ABAP Debuggers,save a few enhancements, watchpoints have. Let’s take a look at each in turn.
Break-Points
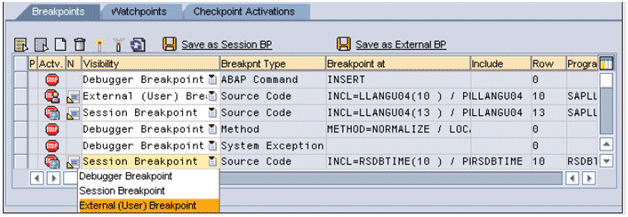
In ABAP there are three different kinds of breakpoints, each of which serve a specific purpose. In releases prior to SAP NetWeaver 2004s, only one breakpoint icon was displayed in the debugger to denote all three types of breakpoints. In SAP NetWeaver 2004s, three different breakpoints icons are displayed in the New ABAP Debugger, as well as in the ABAP Editor, so you know immediately which kind of breakpoint you are dealing with.
You can set debugger breakpoints inside the debugger. They exist only as long as the debugger is active. Once the debugger is closed, all debugger breakpoints are gone.
Usually, you set session breakpoints in the ABAP Editor. The scope of session breakpoints is the current logon session. This means that your session breakpoints are present in all external sessions (i.e., SAP GUI windows) of the current logon session. If you select the Save button in the ABAP Debugger (in a dialog logon session), all current debugger breakpoints are automatically converted to session breakpoints.
If you set a breakpoint inside the coding of a Web Dynpro or BSP application, then the ABAP Workbench automatically sets a user breakpoint. User breakpoints are stored in the SAP database, and they are valid for all logon sessions of the current user on the current application server. If you set a user breakpoint, then all following logon sessions of this user will have those breakpoints set .
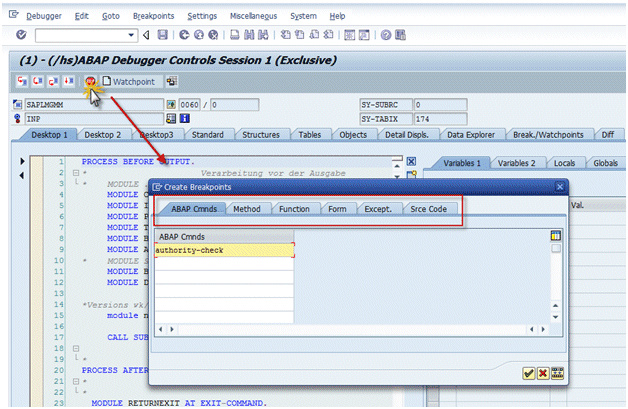
Setting breakpoints in the New ABAP Debugger is not much different from setting them in the Classic ABAP Debugger. If you click on the breakpoint icon in the control area of the New ABAP Debugger, the Create Breakpoints dialog appears. Here you select whether you want the breakpoint to occur at ABAP commands, methods, functions, or forms, or whenever an exception is caught. You can also set a breakpoint at an arbitrary source code position (even in not-yet-loaded programs). This capability is not available in the Classic ABAP Debugger.
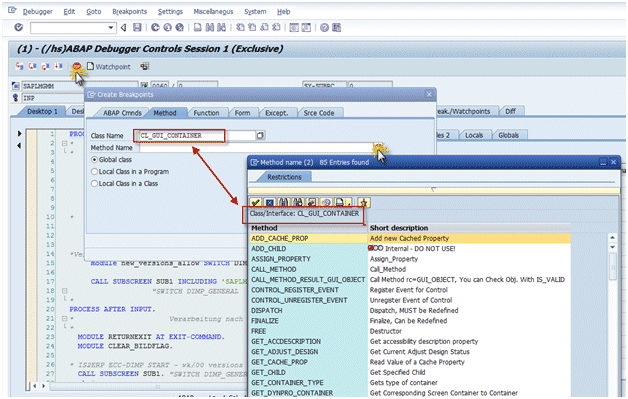
You can get help when you are setting breakpoints at a method, function, or form by pressing F4. For example, pressing F4 in the Method Name field on the Method tab displays all included methods of a given class. So even if you do not have all the details about the method or function module, you can still set a breakpoint. In the Classic ABAP Debugger, there is no such help available.
Using the new Breakpoints tool, which is on the Break/Watchpoints desktop, you can administer all your currently set breakpoints. You can create, delete, activate, or inactivate breakpoints using this tool. In the New ABAP Debugger, you can treat the breakpoints individually. For example you can promote any single debugger breakpoint to a session breakpoint or any session breakpoint to a user breakpoint..etc
Watch-Points
A watchpoint can be set on any variable with local or global scope to break the execution of the program when the variable’s content changes. This makes it easier to debug the program’s data flow.
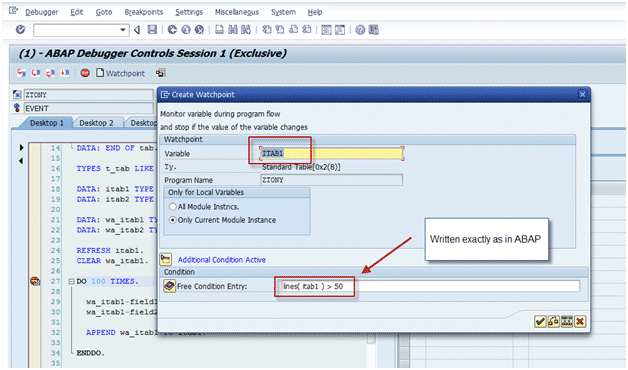
In order to create a watchpoint, click on the Watchpoint button in the control area of the New ABAP Debugger. In the pop-up dialog that appears, you can specify the variable, the scope for a watchpoint on a local variable, and a free condition. The scope for a watchpoint on a local variable means that you can set the watchpoint for only the current instance of the module on the execution stack in which the local variable exists, or for all instances of this module that will be pushed onto the stack. The ability to associate a free condition with the watchpoint is a convenient way to limit the number of “watchpoint reached” events according to your needs. When you specify a condition along with watchpoints, it is a free-style condition for which you can choose two arbitrary operands (no need to specify the watchpoint variable, but you can) and one operator. Write the condition in the same way you would write it in ABAP. You can use two built-in functions as operands in the watchpoint condition….. “lines( itab )” and “strlen( str )” (the number of lines of the internal table itab and the length of the string str, respectively).
For example, I will set a watchpoint on the internal table itab1 to break when it is greater than 50 lines in content.
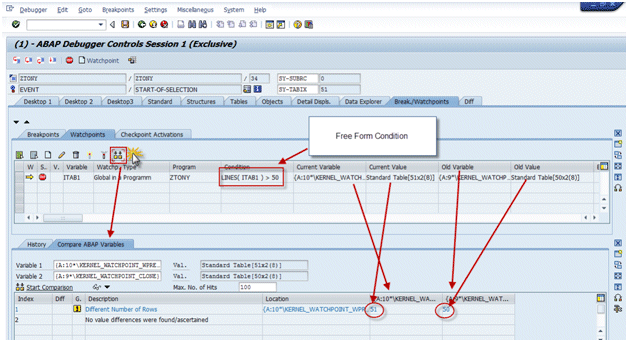
All currently set watchpoints are listed in the Watchpoints tab of the Breakpoints tool. Here you can create, edit, delete, activate, or inactivate watchpoints. In addition to information such as the variable name, the scope, and the condition, you will find in the watchpoint list a symbol for the “old variable” for all watchpoints. This information enables you to view the value of the variable of the recently hit watchpoint before it was changed. I will execute the above watchpoint for illustration of this point…
The final tool I want to explore is the new DIFF tool.
Do you remember this situation…
You are hot on the trail and need to find the differences between two tables. Using the Tables desktop, we can easily create two table views in order to compare the two tables. However, for large internal tables, finding out the differences within an acceptable period of time is not an easy task.
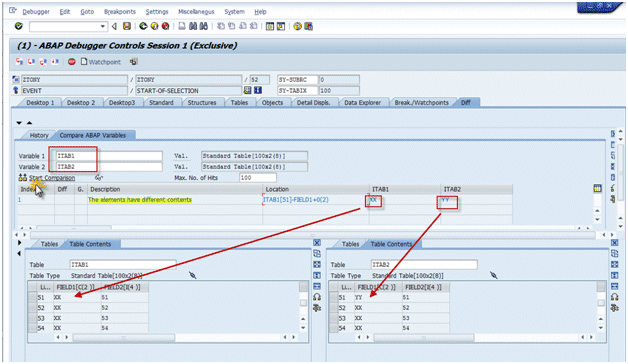
The New ABAP Debugger provides a special tool for this task — the DIFF Tool, which finds the differences between two arbitrary ABAP data objects. You can compare internal tables, structures, strings, or even objects using the DIFF Tool, which provides the differences concerning the types (e.g., one table is a sorted table and the other a hashed table), and of course, the values.
I will start the DIFF Tool for the internal tables’ itab1 and itab2; simply click on the Start Comparison button, and viola, a complete display showing a list of all differences between the two tables.
Final Thoughts……
Now that you know about the most important tools of the New ABAP Debugger, I hope future debugging tasks are easier and quicker for you! Happy debugging!
Here are links to the prior Blogs in this series:
The New ABAP Debugger – Part 1, click The New ABAP Debugger – Part 1
The New ABAP Debugger – Part 2, click The New ABAP Debugger – Part 2


