 Anthony Cecchini is the President of Information Technology Partners (ITP), an SAP consulting company headquartered in Pennsylvania. ITP offers comprehensive planning, resource allocation, implementation, upgrade, and training assistance to companies. Anthony has over 17 years of experience in SAP R/3 business process analysis and SAP systems integration. His areas of expertise include SAP NetWeaver integration; ALE development; RFC, BAPI, IDoc, Dialog, and Web Dynpro development; and customized Workflow development. You can reach him at [email protected].
SAT – Running a trace measurement
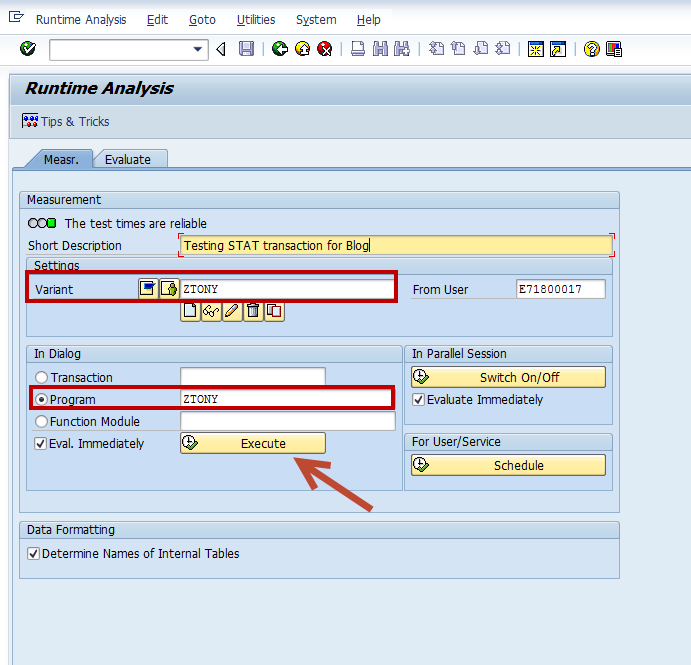
Lets pick up from last month… To recap, we created a measurement variant for transaction SAT and named it ztony. We can now execute a Runtime Analysis in ABAP Runtime Analysis in ABAP on our custom program. All we need to do is enter the name of your transaction (or program, or function module) into corresponding input field of the In Dialog area on the initial screen and press Execute button. in our case our program is also called ztony. (see below)
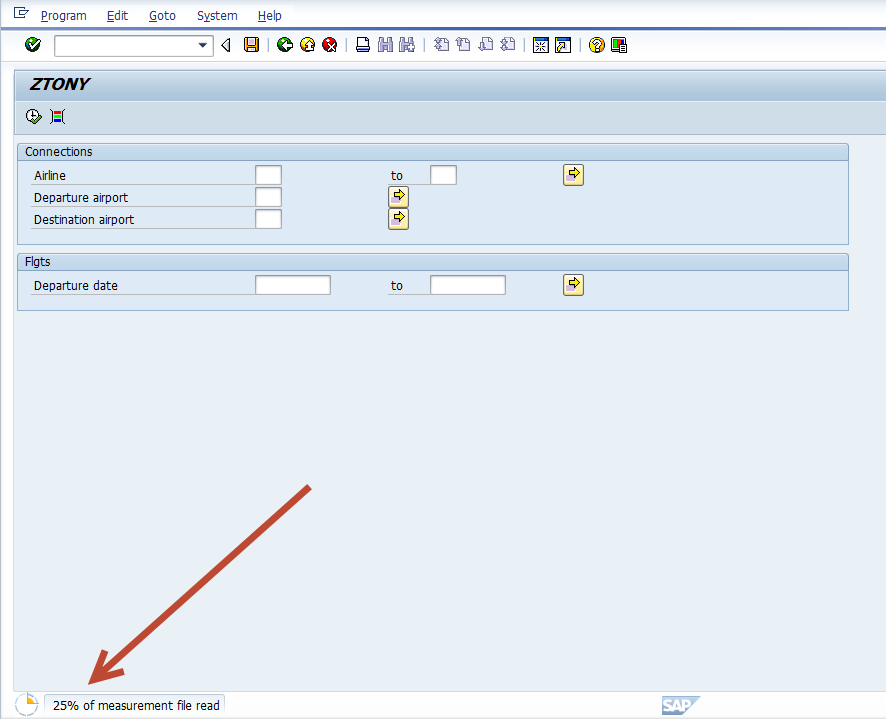
Once you hit execute, the object you are tracing will execute normally. In my case I created a simple ALV Tree for the Flight Tables delivered. So when I execute, I am presented with a selection screen, which I bypass and execute. I am then given the SIMPLE TREE for the grid as a display. I then just green arrow back, and the trace file is read. The system will show how it is progressing using the GUI process indicator. (see below)
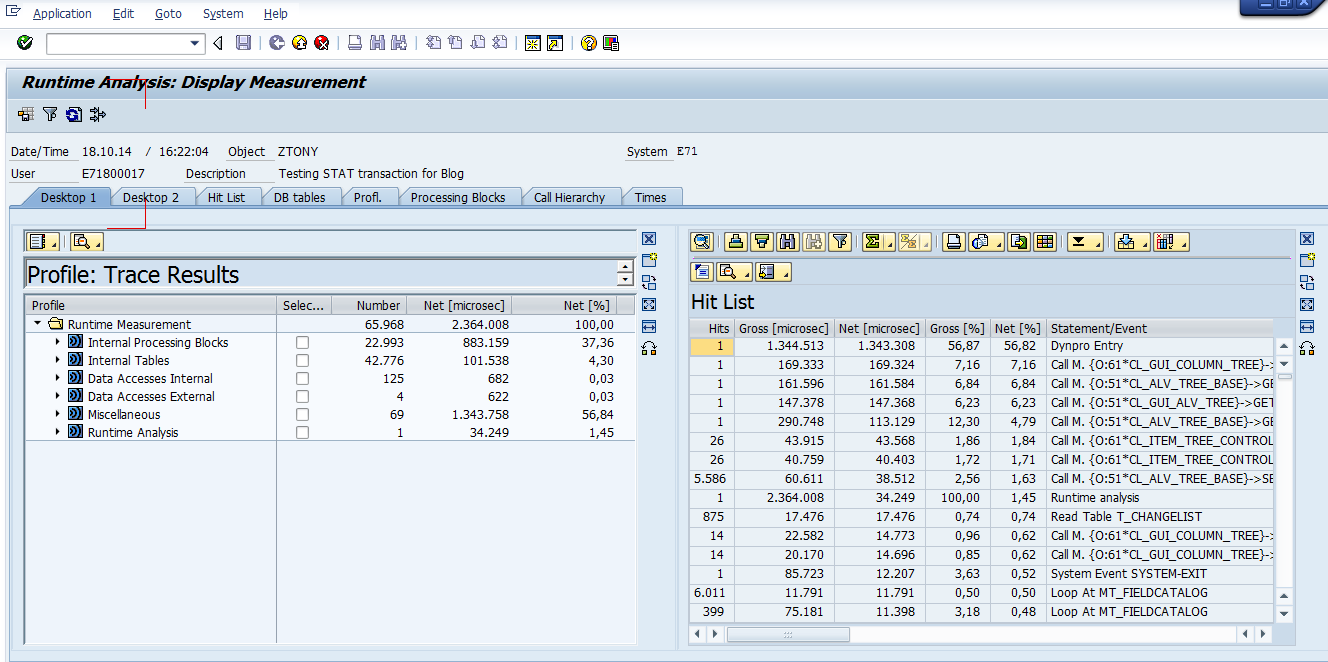
When the trace file has been completely read and formatted, the results screen will appear if you checked the Eval. Immediately check box on the initial screen otherwise go to the Evaluate tab on the initial screen, find your trace result and double click it . You can immediately see the nice work SAP has done with the user interface. It very much resembles the NEW ABAP Debugger (see below)
Using SAT trace evaluation tools
The user interface consists of the desktops. You can set up each desktop as you wish, with up to four trace evaluation tools. By default the Desktop 1 presents tools for analyzing performance and Desktop 2 tools for analyzing program flow. If you remember, the old SE30 transaction offered only two main tools, the Hit List and the Call Hierarchy. SAT offers a rich set of new tools to analyze different aspects of a trace. Lets explore each on in turn.
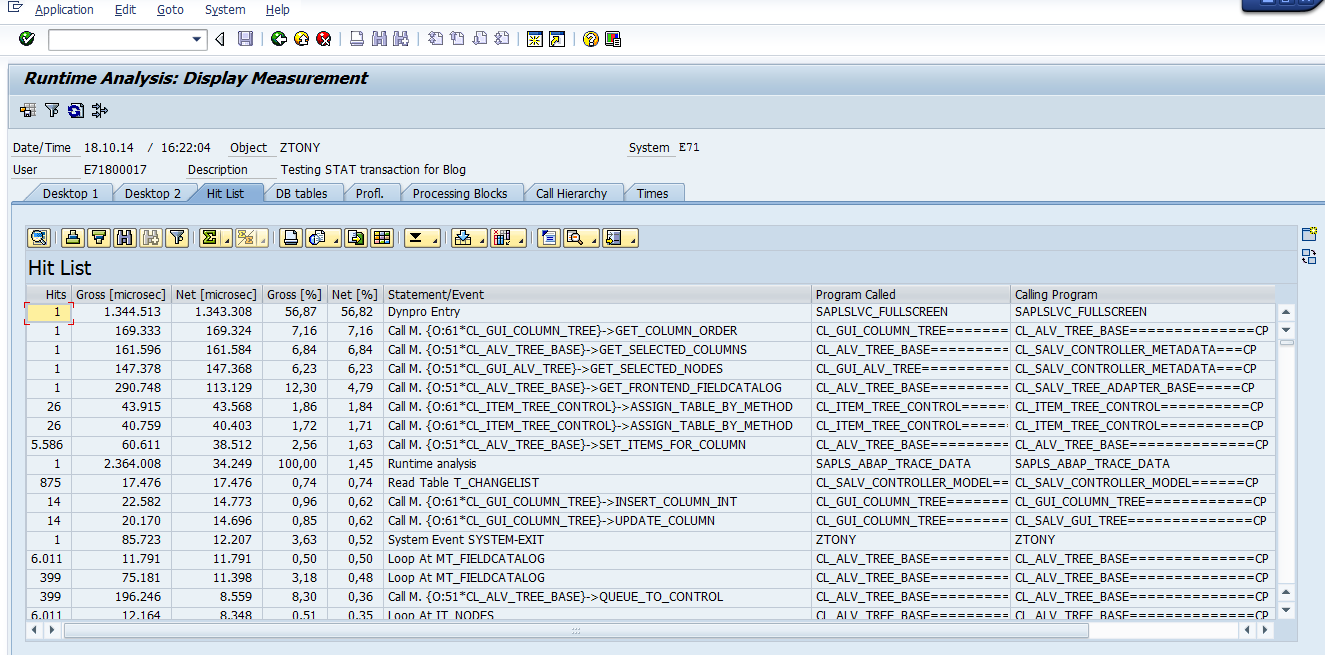
– The Hit List Tool works the same way as in SE30. It displays a hit list of all measured statements. Identical events are summarized into one trace line together with their execution times. But identical events from different calling positions of source code appear as different entries in the hit list.
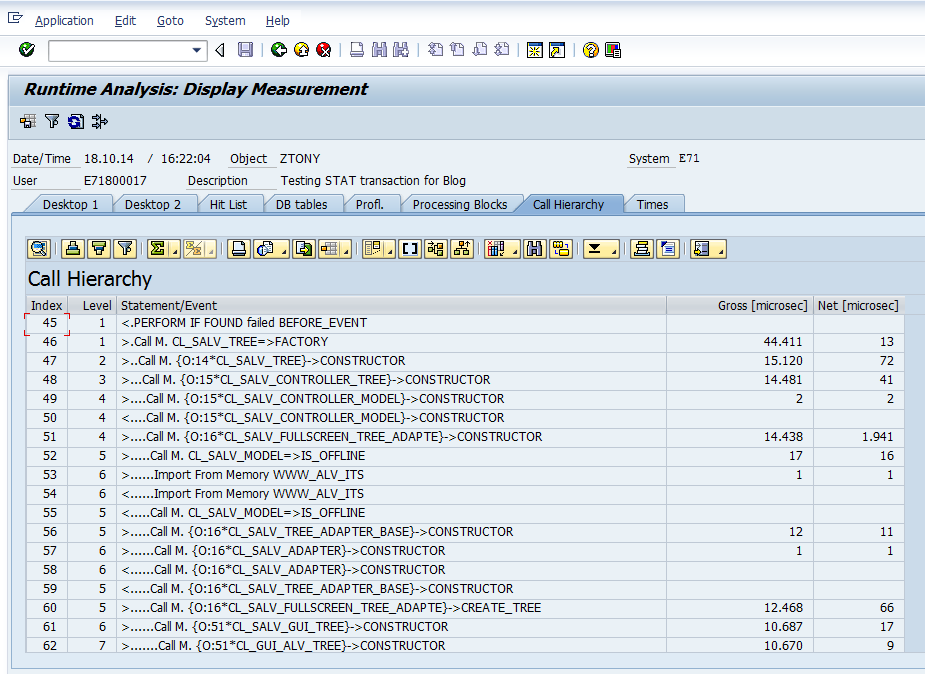
– The Call Hierarchy Tool works the same way as in SE30. It displays operations and events as they occur in a program. You can use Call Hierarchy to display trace events the way they were called by the program. Since the display of the Call Hierarchy is a little large, you can display a Call Stack for a chosen event of the Call Hierarchy or just choose the event and position its display in the Processing Blocks Tool. There you will see all processing blocks (methods, functions, etc.) you configured in your trace measurement variant and can better follow the call hierarchy of the trace event and even display the critical processing blocks in terms of consumed run time or memory
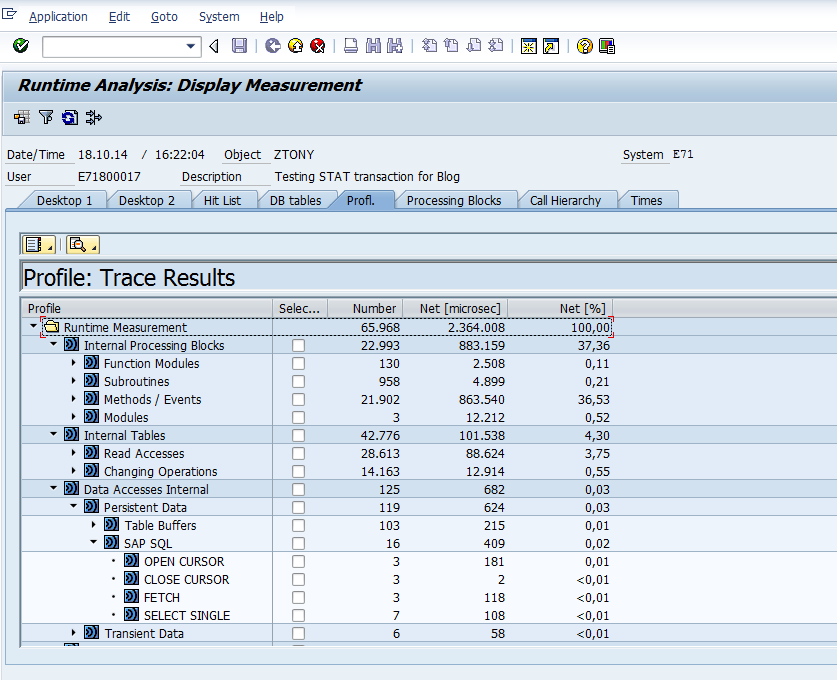
– The Profile Tool shows you the run-time distribution of components, packages, programs and even debugger layers. The benefit of the Profile Tool is that you can start a trace evaluation at your application component (e.g. FI or HR) and drill down the trace results view through the sub-components and their packages in order to follow up on the top performance consumers.
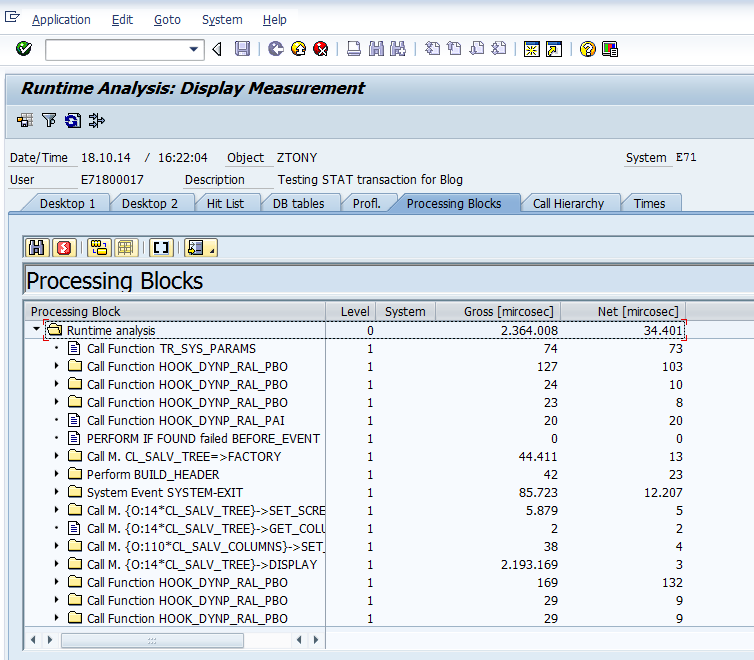
– The Processing Blocks Tool displays a tree of processing blocks as an aggregated view of the call sequence
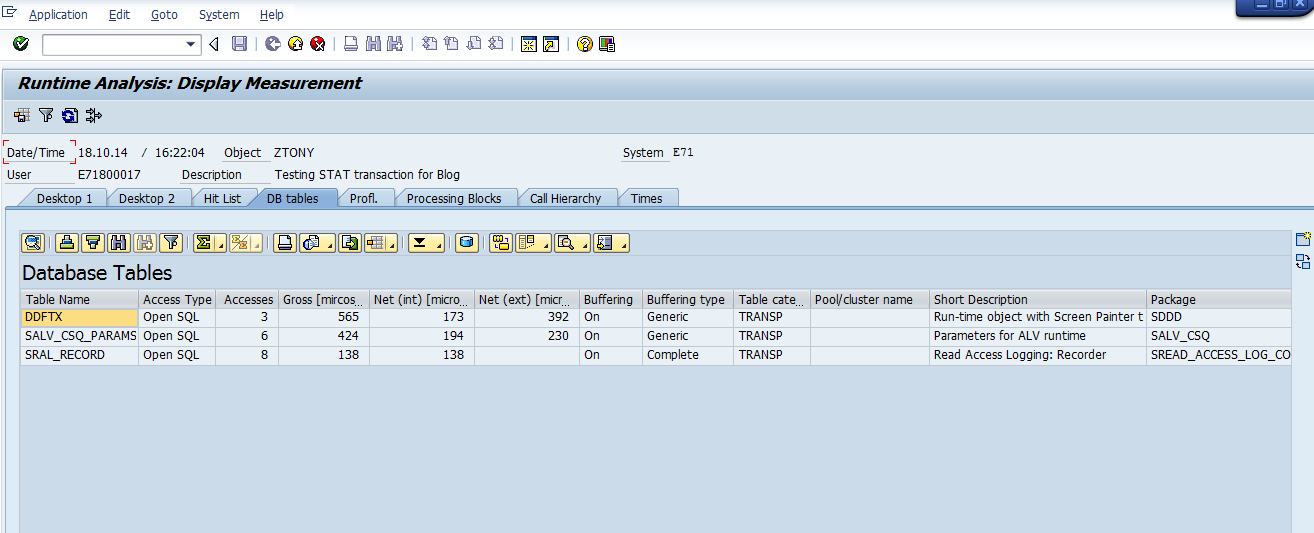
– The Database Tables Tool identifies time-consuming database statements
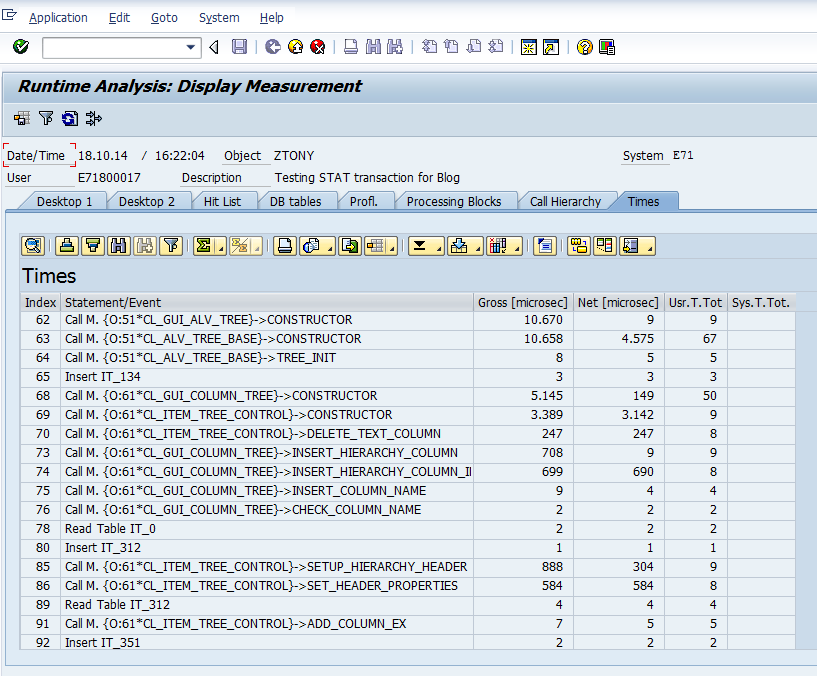
– The Times Tool displays more specific time measurement values for the single events of the call hierarchy
Working with The New user interface
Lets finish this month’s blog by looking at some efficient ways to navigate around the new UI.
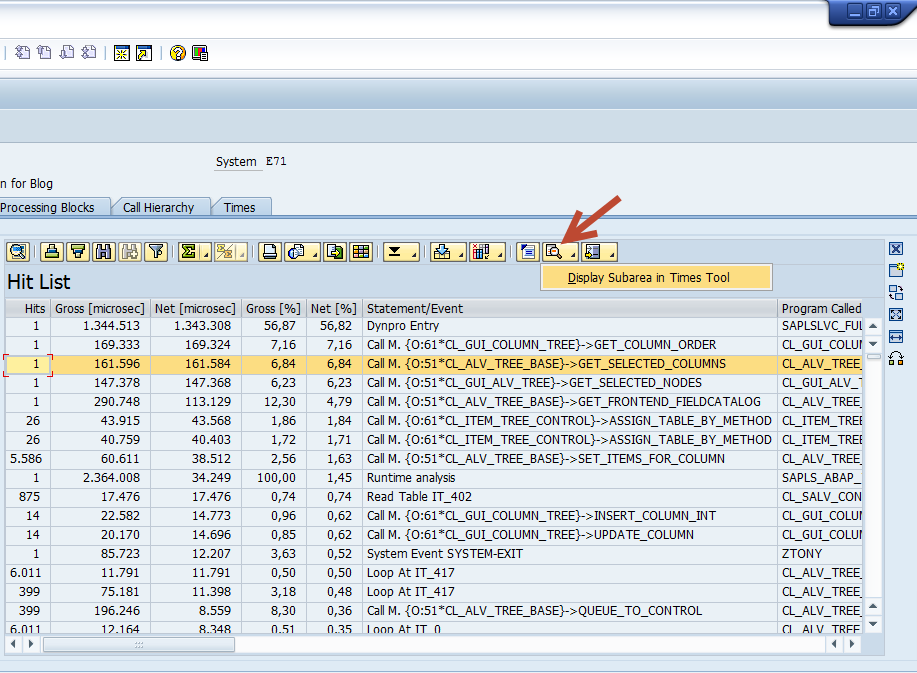
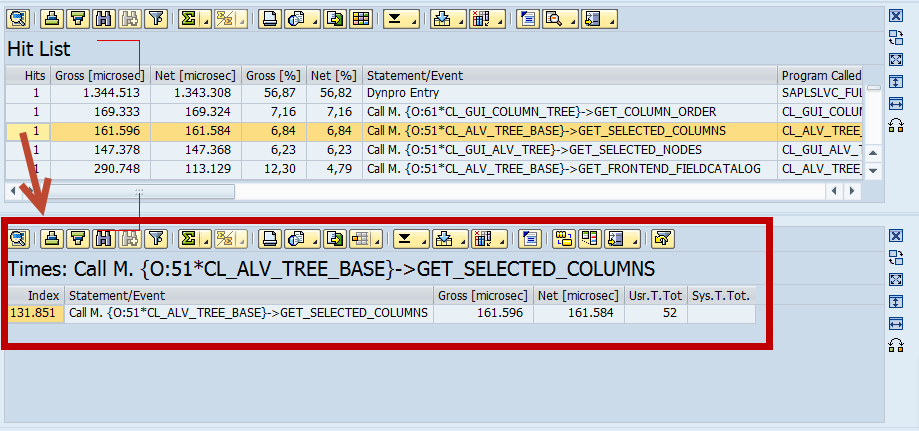
Let’s speculate your are in the HIT LIST and you want to display more details on a specific entry. You can do this by using the Display subarea in… button. First highlight the row with a single click and then click the button. A tool new sub-screen will display with the detail measurement. (see screens below)
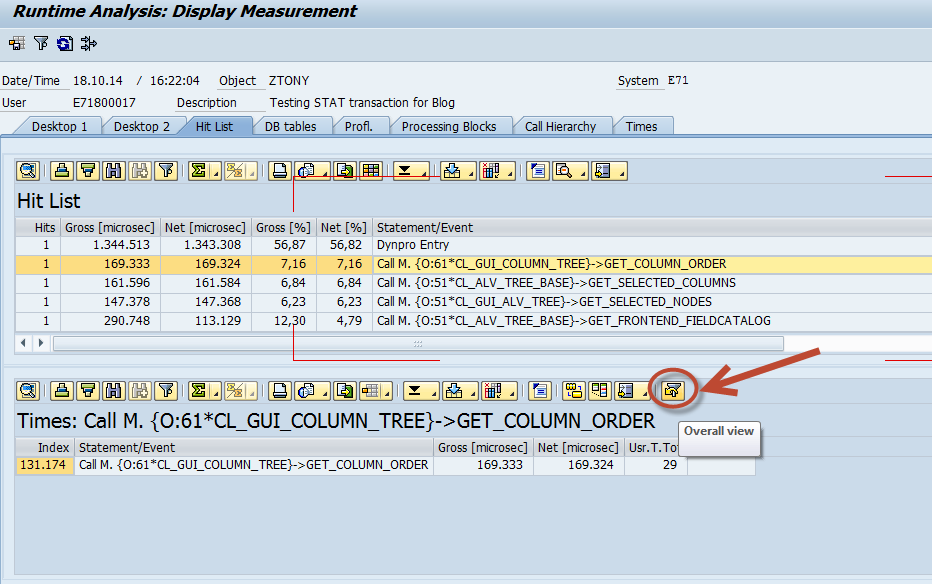
In a very real sense we just “filtered” the HIT LIST. I am guessing that is why the the Overall View button is the one that looks like a funnel..LOL Hit this button to return back to an OVERALL view. (see below)
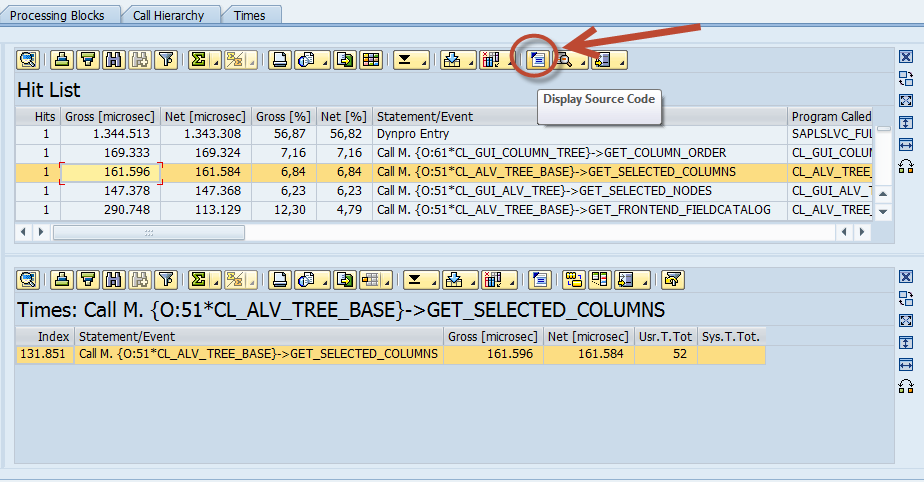
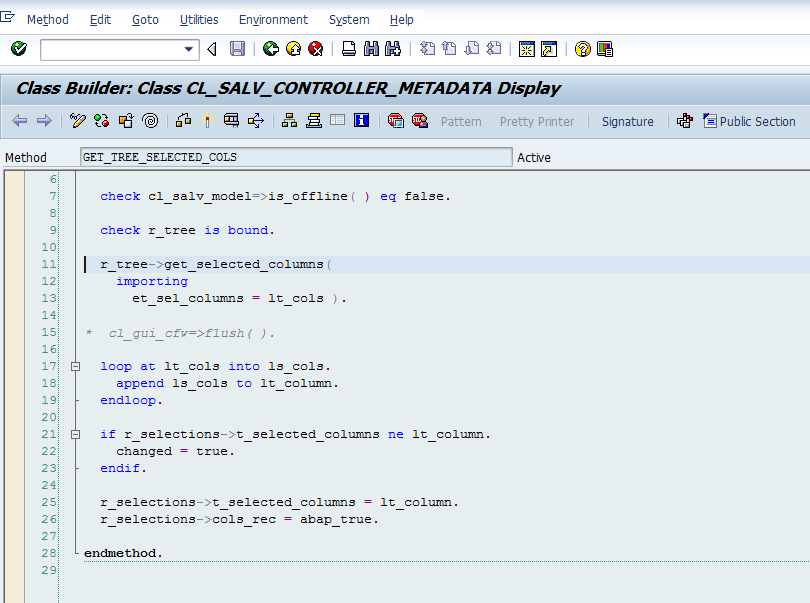
Another nice feature is the Display Source Code button. Again, highlight the row with a single click, then hit the button and you will be brought the source code. You can also achieve the same result by double clicking the highlighted row. (see below screens)
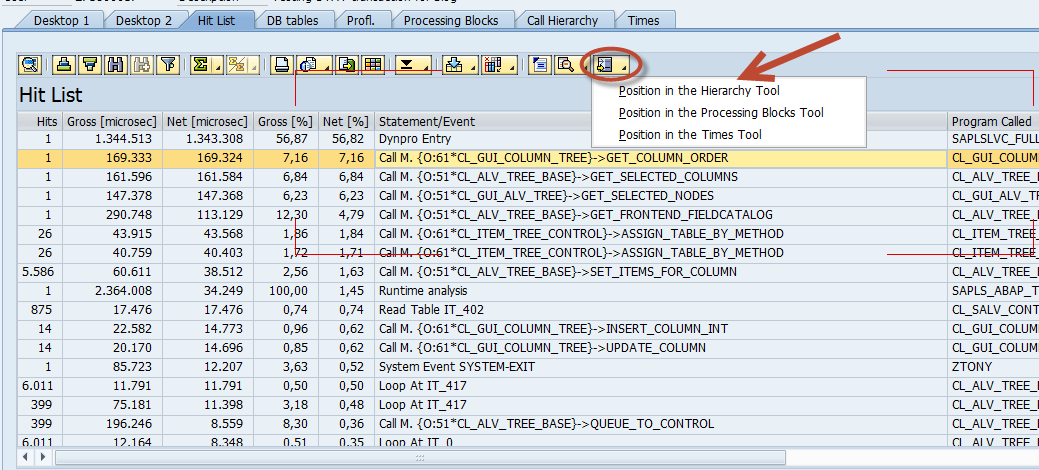
Working with multiple trace evaluation tool screens requires easy navigation between them. By setting the cursor on the trace entry in one tool and using Position in the… button, or by right clicking, use the command of the right-mouse button menu, you can easily examine this entry in another tool. For example switch from the Hit List to the Call Hierarchy. (see below)
There are other common UI commands you can use, such as the Additional information ![]() button to show more fields in the tool display. You can choose for example to display a package, a software component or a person responsible. You could use the Display Call Stack
button to show more fields in the tool display. You can choose for example to display a package, a software component or a person responsible. You could use the Display Call Stack ![]() button to show the call stack for a selected entry. This feature is available only within Call Hierarchy.
button to show the call stack for a selected entry. This feature is available only within Call Hierarchy.
Summary and what’s next…
This is basically everything you need to start using the SAT transaction. We learned how to efficiently navigate the NEW UI tools and tool-sets. We took a deeper dive into each tool to see how to use it.
To read the first part of this blog series, which is an introduction to SAT, click Below.
ABAP Runtime Analysis Using The New SAT Transaction – Part 1
In the next blog of this series we will look at specific usage scenarios of SAT, like performance analysis, program flow analysis or memory consumption analysis.


