Anthony Cecchini is the President of Information Technology Partners (ITP), an SAP consulting company headquartered in Pennsylvania. ITP offers comprehensive planning, resource allocation, implementation, upgrade, and training assistance to companies. Anthony has over 17 years of experience in SAP R/3 business process analysis and SAP systems integration. His areas of expertise include SAP NetWeaver integration; ALE development; RFC, BAPI, IDoc, Dialog, and Web Dynpro development; and customized Workflow development. You can reach him at [email protected].
Why learn how to use the Debugger?
Debugging is the way to find the root cause of SAP transaction behavior (e.g., finding a reason why a certain value in a field was updated or determining why users receive an error, warning, or abnormal termination message during the processing of a transaction). Debugging is necessary if the root cause cannot be determined from functional methods such as checking customizing or master data.
Since ABAP is the backbone of SAP, at one point or another, every member of a functional team must have had to deal with SAP development technicalities behind the business functionality. This need for technical details can occur during various phases, such as writing functional specifications or analyzing a production environment issues.
In this blog I’ll explain basic terminology for ABAP and various tools and techniques for debugging. This knowledge is helpful when you are trying to find the root cause of an issue or designing a needed functionality to fill a GAP in requirements. I will you show the various objects for debugging with some examples, such as debugging for an error message, or debugging a function module.
How to Trigger Debugging
Lets look at some basic ways to trigger debugging…..
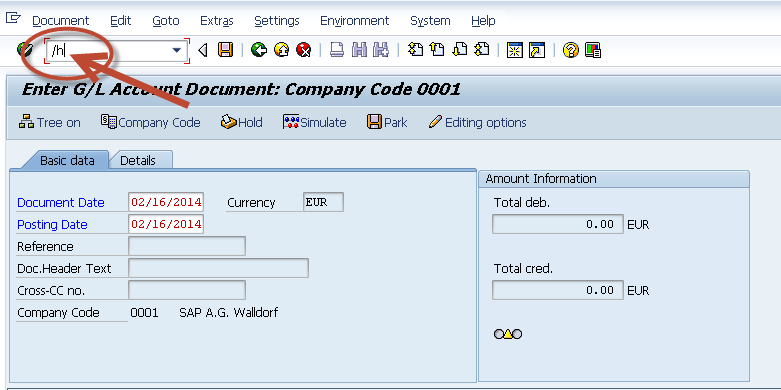
If you are not sure about which line of code you want to debug, enter transaction /h in the command prompt, sometimes refereed to as the OK CODE, while executing any transaction. Press Enter to activate the debugger. (see below)
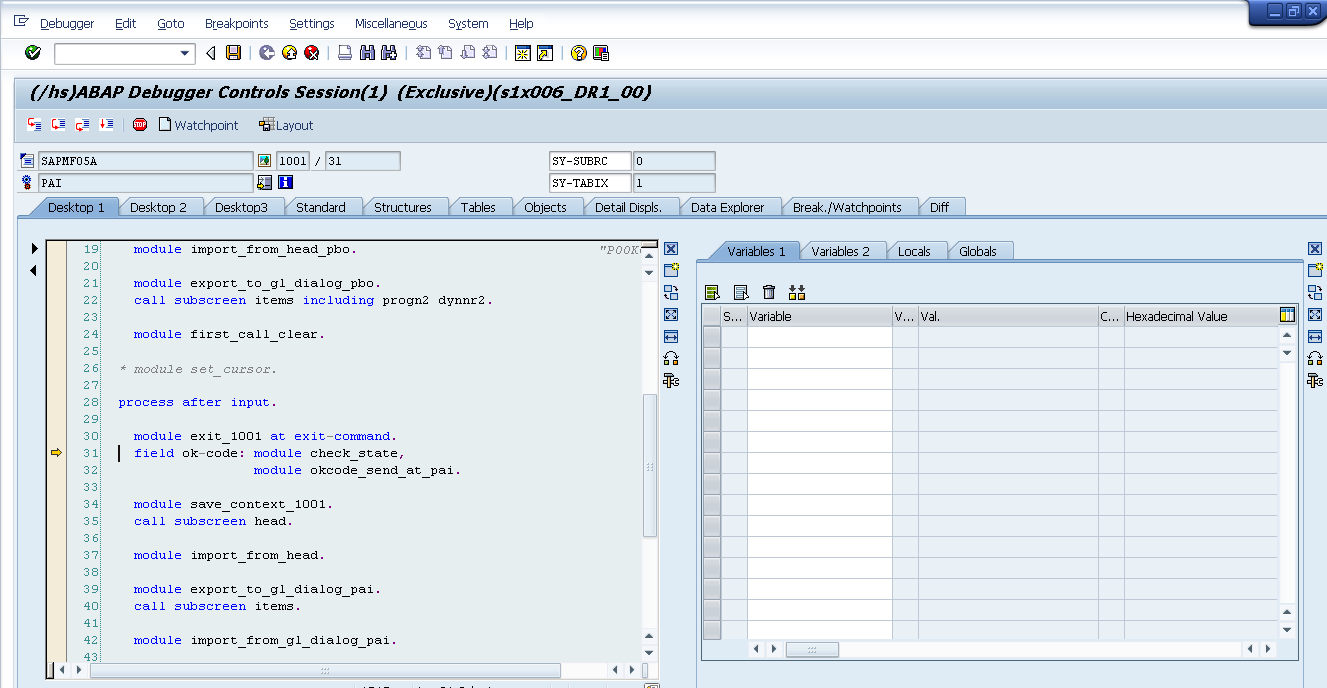
You’ll see the message ![]() in the status line and now if you were to press enter again, or hit save, or perform any function on this transaction, you will see the DEBUGGER screen appear (see below). You will be positioned at the first executable instruction based on the user interaction you performed. If you knew the exact line of code you wanted to have the DEBUGGER screen appear at, then you could use a BREAKPOINT
in the status line and now if you were to press enter again, or hit save, or perform any function on this transaction, you will see the DEBUGGER screen appear (see below). You will be positioned at the first executable instruction based on the user interaction you performed. If you knew the exact line of code you wanted to have the DEBUGGER screen appear at, then you could use a BREAKPOINT ![]() , but we will cover that a little later
, but we will cover that a little later
OK, lets take a look at the debugging screen itself…. let’s start with the control buttons.
Control Buttons
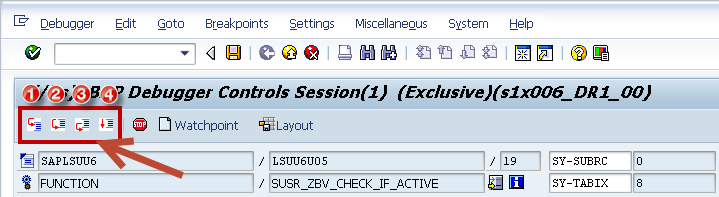
If you look above, you can see four buttons I have highlighted and numbered 1 – 4. The buttons control the flow of the debugging session and are described in detail below….
- Single step (the F5 key). When you click this icon, the debugger control moves to the next line of code in debugging. If the next line is a call to another program, (e.g., the function module), then the control shifts to that program.
- Execute (the F6 key). When you click this icon, the debugger control moves to the next line of code in the same program only, without going inside the code of the function module or program being called in the line of code in which you click this icon.
- Return (the F7 key). When you click this icon, the debugger control returns to the calling program. This icon is useful when you are in a loop or inside a function module or program called from the main program and you want to return to the main program.
- Run/Continue (the F8 key). When you click this icon, the debugger control moves to the next breakpoint set, if any. Otherwise, the debugging is switched off, and the program is executed completely.
Field Display
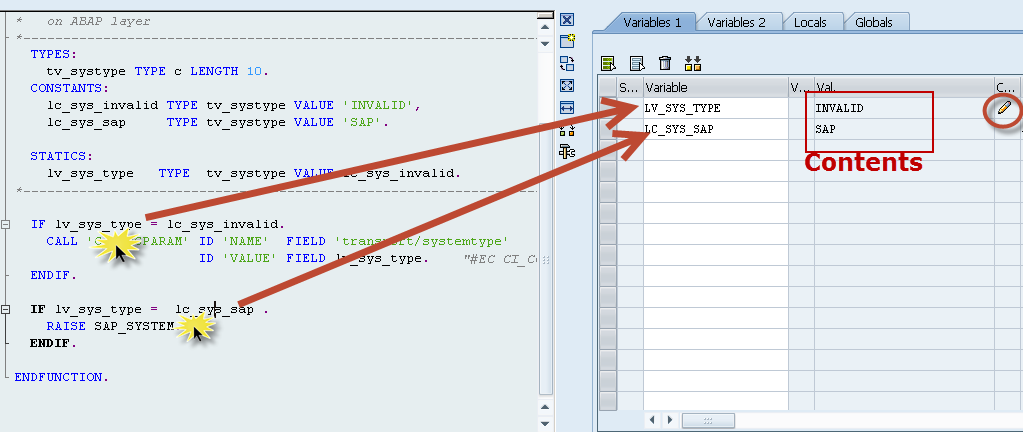
During debugging, the fields display shows the field list. If you click any field in the program, the debugger shows the present value or contents of that field. If for some reason like during testing, you want to use a different value for the field, you can change the field value using the change icon ![]() , but this access in debug is generally given to developers only and NEVER in a production system. (see below)
, but this access in debug is generally given to developers only and NEVER in a production system. (see below)
.
Table Display
Now we need to turn to how we could look into tables. Why? Lets say your looking at a sales order, or purchase Req…etc Well the items are normally stored in whats called an INTERNAL TABLE. This is not to be confused with a DATABASE TABLE like VBAK, or VBAP. The DATABASE TABLES are stored on the Backend DBMS (Oracle, DB2, even HANA) and are PERSISTENT. While the INTERNAL TABLES are NOT PERSISTENT and have a shelf life of the current LUW in Memory.
First, like any field double-click on an internal table in the debugger. You will see the table appear, like any field, on the right hand side. The way you will know this a table is by the ![]() icon. (see below)
icon. (see below)
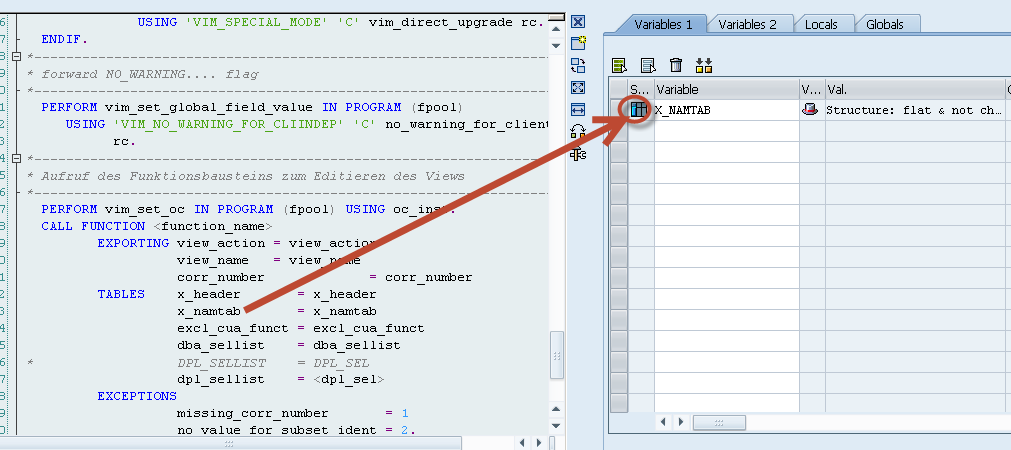
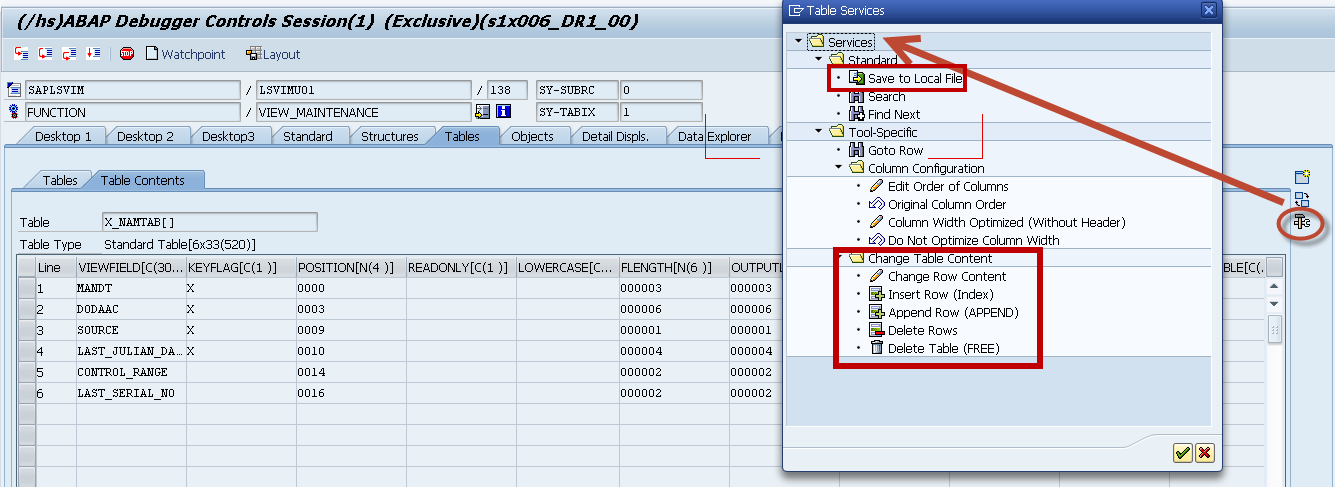
To see the current contents or rows of the internal table double-click the icon. I know you need to know how to add, change or delete rows, so thats when you use the Object Services icon ![]() . Depending on what you are looking at (Field, Database Table, Internal Table…etc), if you click this icon then services relating to the type of object you are working with will be available for your use. For instance you can add,change or delete a row. You can also export the internal table to EXCEL by using the icon
. Depending on what you are looking at (Field, Database Table, Internal Table…etc), if you click this icon then services relating to the type of object you are working with will be available for your use. For instance you can add,change or delete a row. You can also export the internal table to EXCEL by using the icon ![]() . (see below)
. (see below)
Break-Points
Now is a good time to discuss Break-Points. A break-point can be set for a line of code either while in the debugger, or prior while in the EDITOR (SE80/SE38/SE37/SE24). The icon for a breakpoint looks like this ![]() . In contrast, the
. In contrast, the ![]() icon shows you where your are in the execution of an object. Say, you used /h to trigger the debugger and single-stepped one line at a time. Well the
icon shows you where your are in the execution of an object. Say, you used /h to trigger the debugger and single-stepped one line at a time. Well the ![]() icon would continue to move down with the execution.
icon would continue to move down with the execution.
When you double click on a line of code left of the line number, you will set a BREAK-Point. Then when you run the transaction or program, the debugger will stop at that specific line of code and pop up a debugger screen that by now you know well. (see below)
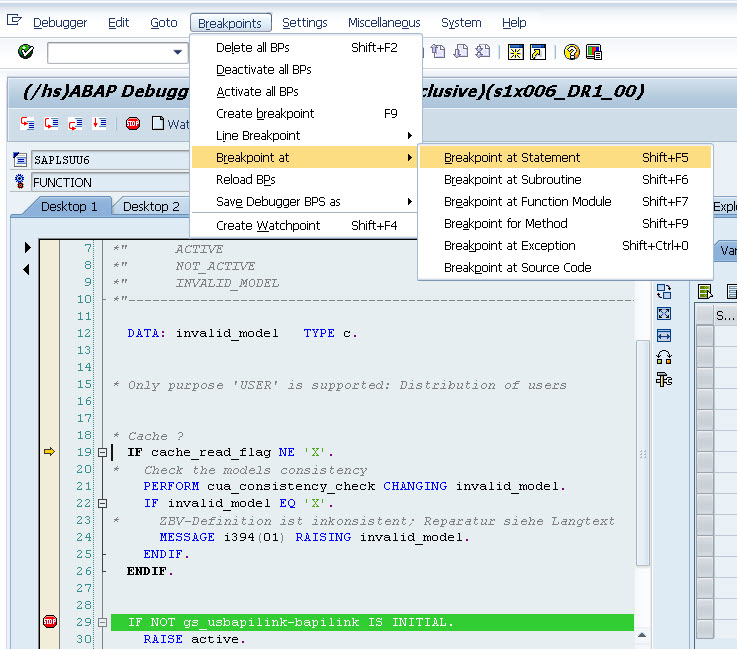
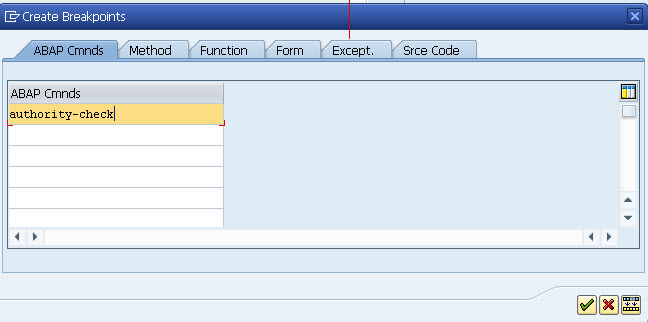
There is more than one way to set a break-point. One of my personal favorites that I have shown above is to use the menu path BREAKPOINTS->BREAKPOINT AT. Here we have many options to set dynamic break-points based on commands, functions, methods…etc. One way to use this is to choose BREAKPOINT AT Statement, and enter the command AUTHORITY_CHECK.
This will cause the object to stop anytime this command is about to be executed. Then when you stop, F6 to execute. Then use the field change capability to alter the contents of SY-SUBRC to zero, if it is not zero already. This is a good way to bypass and use SAP transactions you may not have authorization for. Please remember that you must use caution when doing this, and you will NOT be able to do this in Production.
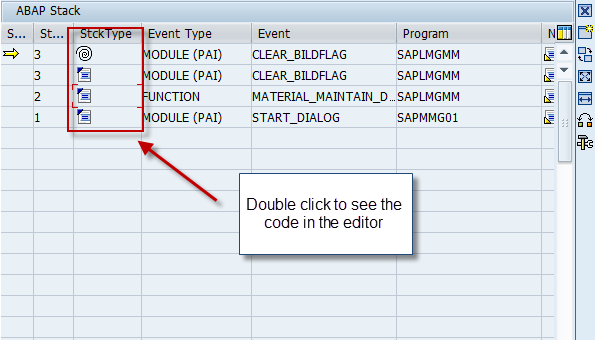
The Call Stack
Lets end this month’s Blog with a look at one more useful tool. The ABAP Stack.
The DESKTOP 2 Tab in the debugger UI displays the ABAP call stack. It allows you to switch to the context of each stack level and navigate to the source code by opening the ABAP Editor, in order to start a deeper analysis of the code in a separate window(just double click!). Also new with SAP NetWeaver 2004s is the ability to display the screen (Dynpro) stack as well. Even more important, you can display a combined ABAP and screen stack to find out on which ABAP level which screen was called, and which screen invoked which ABAP module.
You can navigate from each stack line to the corresponding source line in the editor by double clicking on the icon in the stack type column

If you would like a complete and detailed look at the SAP Debugger, then please view the prior blogs below. You will be a debugging expert in short order and wow your Functional associates with your skill and prowess!
The New ABAP Debugger – Part 1
The New ABAP Debugger – Part 2
The New ABAP Debugger – Part 3
In next month’s Blog we will look at specific scenarios that cause RuntimeError Debug opportunities. I’ll show you how to use a Debug Command even in the Batch environment! So stay tuned!