 Anthony Cecchini is the President of Information Technology Partners (ITP), an SAP consulting company headquartered in Pennsylvania. ITP offers comprehensive planning, resource allocation, implementation, upgrade, and training assistance to companies. Anthony has over 17 years of experience in SAP R/3 business process analysis and SAP systems integration. His areas of expertise include SAP NetWeaver integration; ALE development; RFC, BAPI, IDoc, Dialog, and Web Dynpro development; and customized Workflow development. You can reach him at [email protected].
Software Layer-Aware Debugging (SLAD) in NetWeaver 7.0 EHP2
How many of us have had this happen during debugging? You need to analyze a bug, or you want to find out how an application works. And you don’t know where exactly to set a breakpoint. So you start the ABAP Debugger and start stepping through the code. And you keep on stepping through the code, endlessly, without reaching any of the application logic in which you are interested!
Well there is a solution and its Software Layer-Aware Debugging (SLAD), sometimes referrefd to as Profile Controlled Debugging. With NetWeaver 7.0 EHP2, which is delivered with Enhancement Package 5 of SAP ERP, ABAP brings you an elegant solution to the problem of reaching the code you want to debug: layer-aware debugging.
The basic idea of layer-aware debugging is simple: you separate the code in the system into the code that you want to debug and all the rest that you don’t want to see. You tell the New ABAP Debugger about this, and the debugger lets you jump right to the code you want to see, skipping over (optionally) all the rest of the code.
Take a look at this short film demonstrating Layer-Aware Debugging: Demo: ABAP Layer-Aware Debugging.
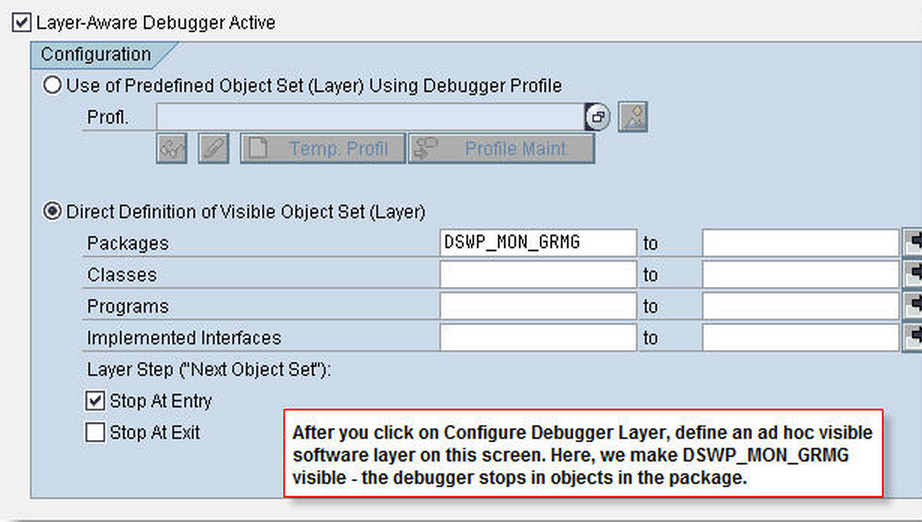
You can vary software layers along these dimensions:
Granularity: You can define an object set broadly, as the list of software packages in a package component, for example. You can also define very narrow object sets, citing individual programs, classes, and function modules.
Visibility: You can specify in an object set whether code is visible in the debugger. You can also specify how the debugger should behave when it finds code from the object set – stop on entry, stop on exit.
Flexiblity: You can include multiple object sets in a profile, so you can modulate the behavior of the debugger with respect to software layers precisely. And a profile can specify what the debugger should do with all the rest of the code that is not defined in object sets.
Read the rest of the blog here Layer-Aware Debugging in NW 7.0 EHP2
In summary, Layer Aware Debugging (Software Layer Aware Debugging, profile-controlled debugging) is useful in the following situations:
– To debug only the part of the relevant code you are interested in (for example, the code for which you are responsible). All irrelevant code (the system framework and so on) is hidden during the analysis. You can also see all entry points to the code you are interested in, that is, who is calling your layer and with which parameters.
– To get through the code in big steps, by jumping from layer to layer or from component to component, instead of single-stepping through the whole code until you finally reach the point of interest.