 Anthony Cecchini is the President of Information Technology Partners (ITP), an SAP consulting company headquartered in Pennsylvania, with offices in Vienna, VA. ITP offers comprehensive planning, resource allocation, implementation, upgrade, and training assistance to companies. Anthony has over 20 years of experience in SAP business process analysis and SAP systems integration. His areas of expertise include SAP NetWeaver integration; ALE development; RFC, BAPI, IDoc, Dialog, and Web Dynpro development; and customized Workflow development. You can reach him at [email protected].
In this 2 part Blog series we will take a deep dive into QLIK Desktop. In Part #1, we will go thru all the steps you need to understand when creating a new QLIK Desktop App for guided analytics. In Part #2 of the Blog we will cover data sheets and stories to customize the interaction of your app. This is where the power and flexibility of Qlik become evident. All the data objects are drag and drop allowing the user to create visualizations by selecting data objects, then drilling down to examine associations.
Building your first Qlik Sense App
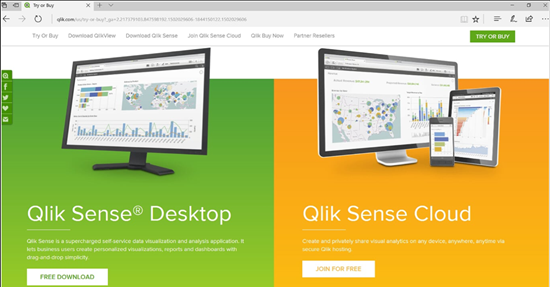
Let’s take an in-depth look at creating a new app on Qlik Sense Desktop. If you haven’t already, you will need to download the free edition of Qlik Sense Desktop from the Qlik website. Click on the screenshot below…
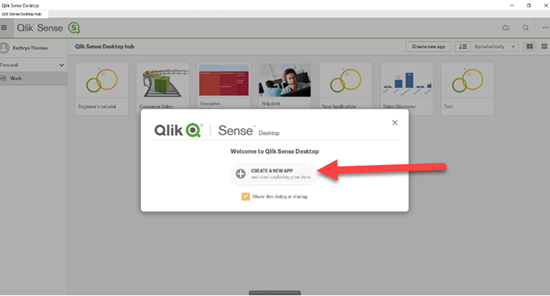
In this blog, we will primarily focus on the desktop version. After downloading and installing Qlik Sense Desktop, you can open it from an icon on your start bar or an icon on your home screen. It will open to a screen inviting you to create a new application. If you have worked in Qlik before, the welcome screen will give you the option to open a previous application.
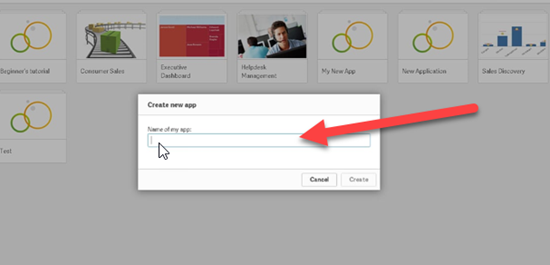
Onc you click on create a new app, you will be asked to give the app a name. We will call this one “My New App”.
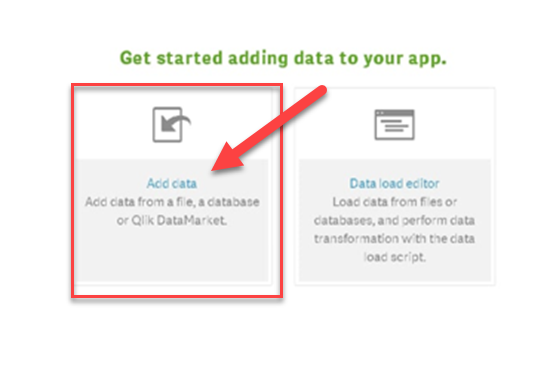
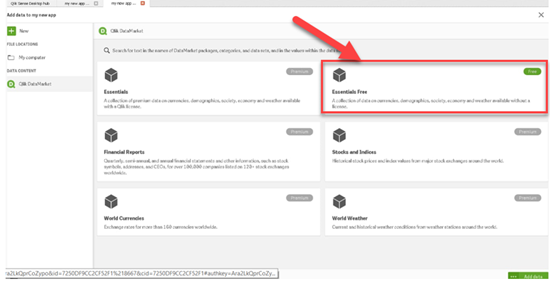
The next step is to connect to the data you want to use for your app. You can choose from any data file on your computer or your network including Microsoft Excel, Microsoft SQL, MySQL, ODBC, SAP HANA, Oracle, and web files. Or you can link to one of the data files in the Qlik Data Market.
For our purposes, we will connect to “Essentials Free”.
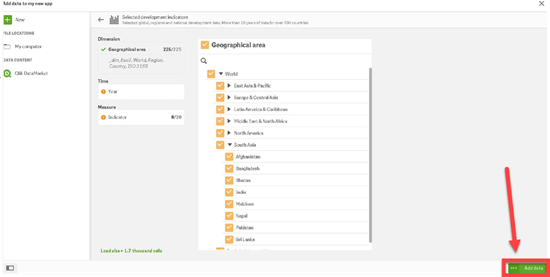
Navigate through the Economic data to Selected Developmental Indicators, then Geographical Data. Note that the data is frequently updated, so your choices may look a little different. Choose the data you want, then choose the green “Add Data” button on the bottom right of the screen.
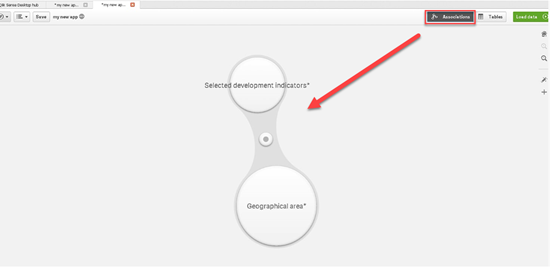
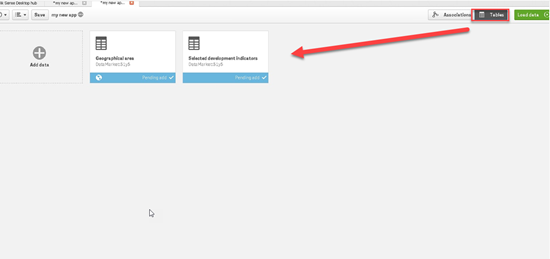
For this example, we will use Adult Literacy Data for 2015. After the data uploads, Qlik will give you two viewing options: Associations and Tables. The information is the same but presented in two different ways.
QLIK ASSOCIATIONS
QLIK Tables
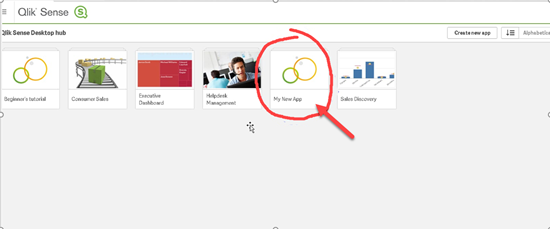
Click on Save and your new application will appear in your Qlik Sense Desktop hub.
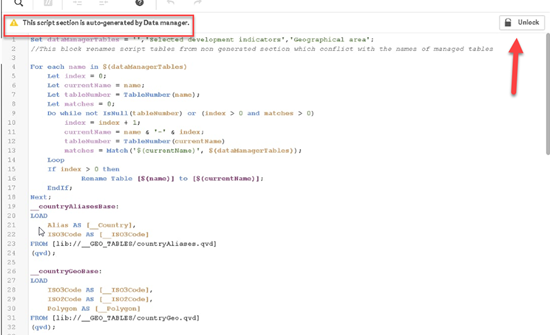
When you open a Qlik application by double-clicking, you will have the option to reload or update the data. The loading process may take a few minutes depending on the size of the file and your connection speed. Qlik auto-generates a script for loading the data, but you have the option of unlocking the script and customizing it as you prefer.
Summary
Now that your app is created and the data is loaded, you can create data sheets and stories to customize the interaction of your app. This is where the power and flexibility of Qlik start to shine. All the data objects are drag and drop allowing the user to create visualizations by selecting data objects, then drilling down to examine associations. Qlik offers multiple bar charts, pie charts, tables, and mappings, but you can also create custom objects in the Qlik Sense Dev Hub. We will cover this in next month’s blog.
QlikSense offers a free Qlik download to their desktop and cloud versions. Qlik provides an extensive Qlik knowledge base, YouTube Qlik training videos, and a Qlik Resource Library with tutorials and on-demand webinars.


