 Anthony Cecchini is the President of Information Technology Partners (ITP), an SAP consulting company headquartered in Pennsylvania. ITP offers comprehensive planning, resource allocation, implementation, upgrade, and training assistance to companies. Anthony has over 17 years of experience in SAP R/3 business process analysis and SAP systems integration. His areas of expertise include SAP NetWeaver integration; ALE development; RFC, BAPI, IDoc, Dialog, and Web Dynpro development; and customized Workflow development. You can reach him at [email protected].
Troubleshooting ABAP
SAT is the transaction name of the new ABAP Runtime Analysis in ABAP Tool, which is one of the most significant improvements in ABAP in the NetWeaver 7.0 EhP2. For those of you who are already familiar with the transaction SE30, the former ABAP Runtime Analysis Tool, transaction SAT is the successor of SE30. SAP has completely enhanced the tool with effective new analysis tools and features. The old SE30 transaction offered only two main tools, the Hit List and the Call Hierarchy. SAT offers a rich set of new tools to analyze different aspects of a trace. Some other benefits include a modern UI, new analysis tools, easy navigation between tools…etc…etc. This first blog of the series about SAT gives overview of the most useful SAT improvements (particularly in comparison with the former SE30) and gives a quick “how to” in order to get you started using this for a runtime analysis of any ABAP application.
Getting Started
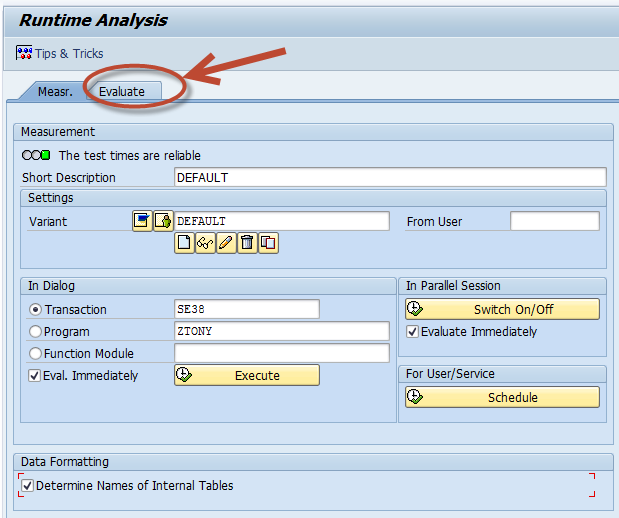
Starting a trace measurement in SAT is quite similar to SE30. There are no major changes on the first screen from SE30 to SAT. A new tab Evaluate has been added to the screen. On the Evaluate tab you can take a look at existing trace measurements results with their status, date of creation, total runtimes. Only your traces are shown, but you can change this by right-clicking on the column Trace user and choosing the Set Filter (see below)
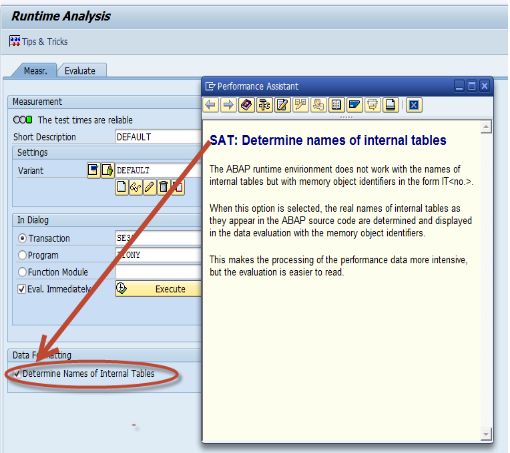
In the old SE30, internal tables were identified only by their internal names (IT_<no>). A nice feature in the new SAT transaction is that now SAP can determine and show the names of internal tables as they appear in your ABAP source code for the trace measurement results.
Another new benefit of SAT is a new storage system for traces. SAT stores traces in the database. That means that you can display a trace from any application server in the system (in SE30 only traces of the current application server are visible). When you display a trace measurement result the first time (e.g. by you double clicking it on the Evaluate tab), it gets formatted and written to the database.
Measurement Variants
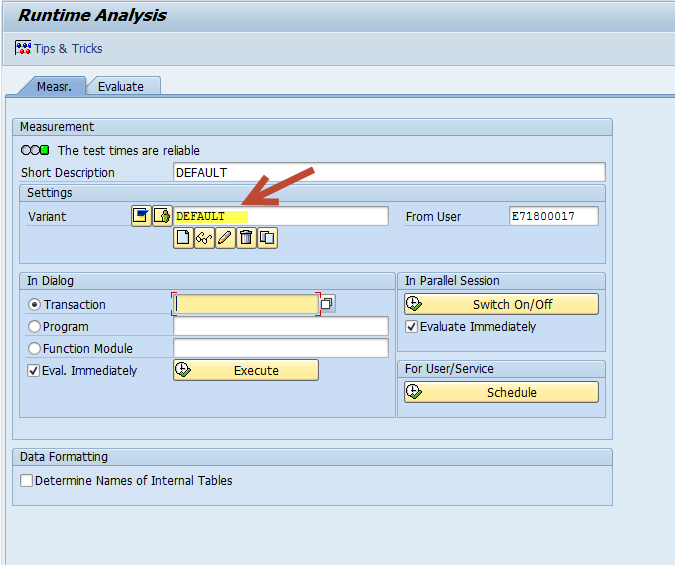
Variants are the foundation of all measurements in the Runtime Analysis transaction. You can maintain trace conditions and restrictions in a variant for the new SAT transaction, the same way you did for SE30. A default variant named “DEFAULT” is supplied by SAP. We recommend you create your own variant. (see below)
To create your own variant use the ![]() button in the Settings area on the initial screen. You will see the screen with three tabs, which you already know from the SE30: Duration and type, Statements, Program Parts. (see below)
button in the Settings area on the initial screen. You will see the screen with three tabs, which you already know from the SE30: Duration and type, Statements, Program Parts. (see below)
The main goal of using a variant is to get the trace data you need while keeping extraneous data and storage use to a minimum. Especially for long running trace measurements. To help out, below our some tips within each of the Tabs to restrict the results while still getting you the trace data you need.
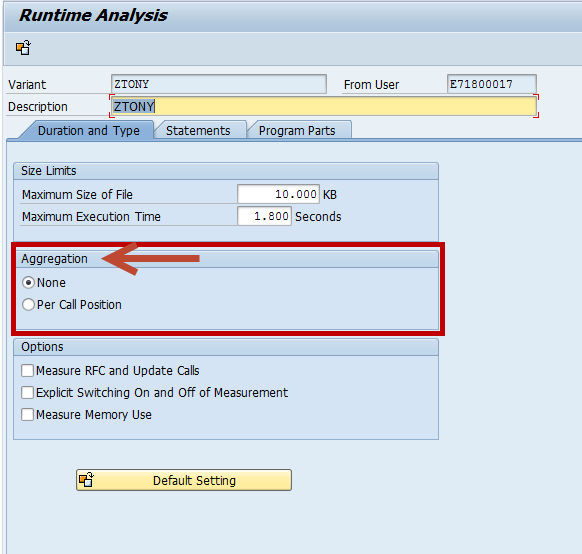
OK, lets say your Object has method FORMAT_SCREEN. Your Object calls this method 20 times. One way to restrict the size of the trace file can be found on the “Duration and Type” tab. There you will see a set of radio buttons for aggregation. (see below)
If you were to choose None, then the trace file would have 20 entries with runtimes, which could result in a larger trace file then you need. So what happens if you choose Per Call Position? You would get only one entry created in the trace file, which would contain 20 as number of the hits and the sum of the runtimes. If you extrapolate this out, say it was called 100 times, you could see how the trace file size could grow needlessly. One caveat, if your intention is to create a Call Hierarchy in your trace, then it seems reasonable that you could not select Aggregation you must select NONE and you will get the object flow.
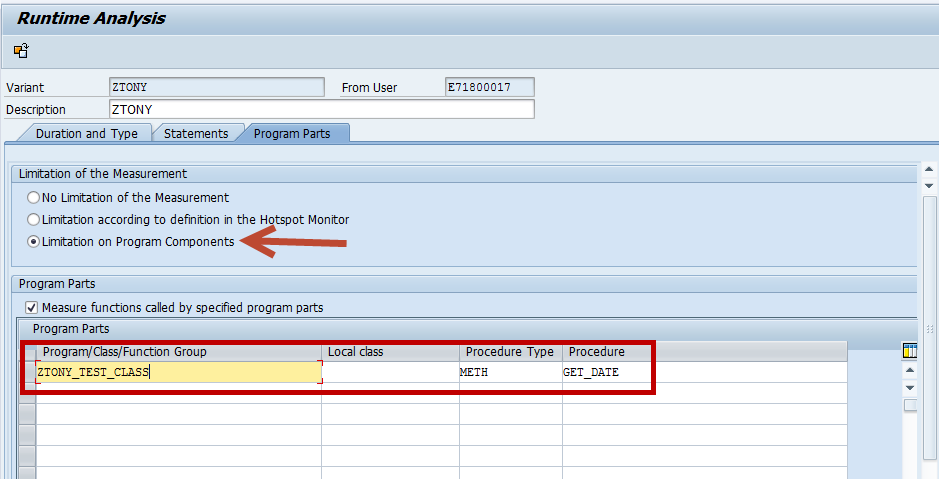
Ok, now lets set some useful guidelines… First if you have an idea where the issue is, for instance inside a certain class, function group, subroutine, or method, name it on the Program Parts tab. To do this go to that Tab and set the Limitation on Program Components radio button, then add the specific object elements in the Grid below.
OK, so you don’t know where to start. OK, well don’t trace everything! Start small and widen the net. For instance, in the Statements Tab start with only Processing Blocks in a first run to find out the relevant parts of the code being hit. If this is a Dialog, then you’ll be interested in the flow Logic and Modules in the Screen section. Again, you might be interested in SQL, so the Database Accesses section may be where you start. I am just saying be smart and fence the issue in until you can switch over to the Program Parts Tab and name the specific area, like we did above, that has the problem.
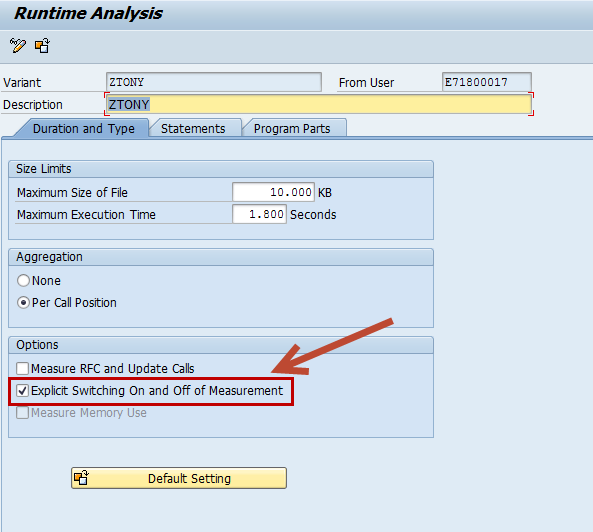
One final way to restrict the size of the trace file is to switch the trace on/off only where you need it. For example if you are interested in a specific begin and endpoint, like between the initial screen and the first ALV grid, of a transaction then this option allows you to switch the trace on or off during that ABAP program execution. You do this on the Duration and Type tab under options. (see below). You must also activate Limitation on Program Components on the Program Parts tab.
The trace will be started as soon as you enter “/ron” (trace on) in the OK code field in your transaction. With “/roff ” (trace off) the trace is stopped. The runtime analysis can be switched on and off in the program as well using the ABAP statement SET RUN TIME ANALYZER {ON|OFF} in the source code. And finally you can also use the menu path: System -> Utilities -> Runtime Analysis -> Switch On / Switch Off.
Summary and what’s next…
We learned that the new SAT transaction is what we should use from now on for our Runtime Analysis needs. It has many advantages, including a new UI look and feel, better tool integration, and a host of evaluation tools which we will begin diving into in the next blog when we take our variant just created and run a trace measurement.


