
Jonathan Andre is a lead ABAP developer at IT Partners. Jon is also the President of Andre Technical Consulting LLC located out of Centreville, Virginia. Jon has over 5 years experience with SAP, with a concentration on ECC SD, MM, and IS-OIL modules. Jon’s focus has been in the areas of ABAP OOP and ABAP Web Dynpro. He can be reached at [email protected]
This month’s article will be a study in the use of little-known tool available in the ABAP Debugger, the Web Dynpro Tool. The author is a co-worker and a friend. I first worked with Jon during his tenure as a SAP ABAP developer on a DOD project. Jon is an extremely intelligent and motivated developer. His desire to take “ownership” of the task assigned and see it through to completion is evidence of his strong work ethic and commitment to excellence. I am sure you will find this month’s post informative and actionable in your current working environment.
Introduction to the Web Dynpro Debugger Tool
Web Dynpro can be a tricky technology to master. The complex interaction of views, windows, components and contexts can at times be difficult to understand and frustrating to work with. Debugging Web Dynpro applications with the standard debugger is often even more frustrating than developing for it. It requires navigating an endless number of web of objects, never quite knowing the best way to reach the next view or window you want to investigate.
Fortunately, SAP has provided a very useful Web Dynpro tool that can be used to debug Web Dynpro applications. This tool allows users to analyze their Web Dynpro applications real time in a structured format that resembles regular Web Dynpro development in SE80.
This post will focus on introducing the Web Dynpro tool using an example scenario that I often see in practice. Along the way, I’ll attempt to point out other useful features that should help readers become more comfortable with the Web Dynpro tool, and debugging Web Dynpro applications in general.
Preparing to Use the Web Dynpro Tool
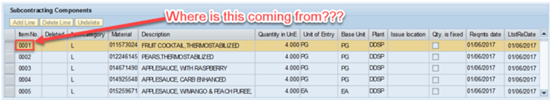
In this example we have a view element (a TextView to be exact) that is displaying the incorrect information (not actually true, but let’s pretend). This TextView displays the current sequence number of a bill of material item, so I would like to determine when it is being populated and what business logic is being used to populate it. (see below)
Before I’m ready to begin using the Web Dynpro tool, I need some very basic information about the element and view I am investigating (I have explained where to find this information at the end of this article for those less familiar with Web Dynpros).
- Component of the view: /SAPPSSRM/WDC_DO_SUBCON
- View itself: V_SUBCON
- TextView ID: ZSUBCON_SEQUENCE_NO_EDITOR
- Context Node of Attribute: ZSUBCON_COMP
- Name of Node Attribute: SEQUENCE_NO
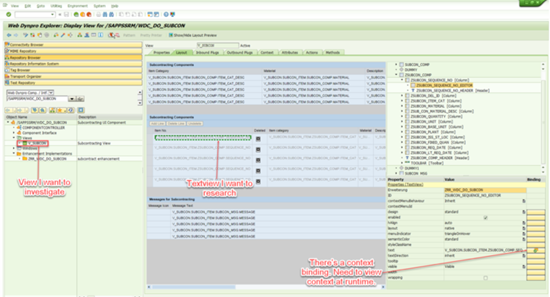
- This can all be determined by navigating to the view within the Web Dynpro Explorer in SE80.
For this particular case, I notice that there is a context binding for my TextView. TextView ZSUBCON_SEQUENCE_NO_EDITOR is bound to ZSUBCON_COMP->SEQUENCE_NO, and so by tracking the value of the SEQUENCE_NO attribute, I will be able to determine the value of the TextView itself.
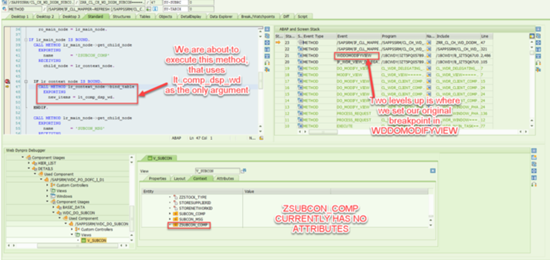
With this information in hand, I would also like to set a breakpoint with the WDDOMODIFY method of the V_SUBCON view controller to serve as a good starting point in the investigation. (see below)
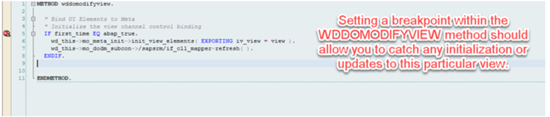
After we set our breakpoint, we are ready to execute Web Dynpro application and, hit our breakpoint. Once the code has stopped at this point and our debugger has opened, we can retrieve the Web Dynpro tool and begin the investigation.
Opening the Web Dynpro Debugging Tool
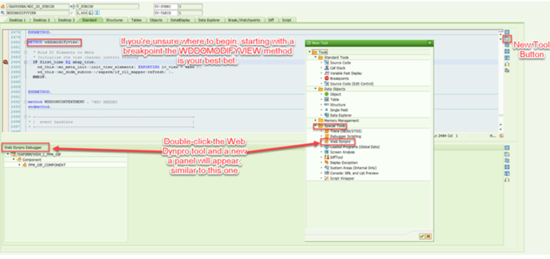
To retrieve the Web Dynpro tool, while in the ABAP Debugger, click the “New Tool” button (usually in the top right corner of an existing tool, if space is available), expand the “Special Tools” folder, and double-click the “Web Dynpro” tool icon. (see below)
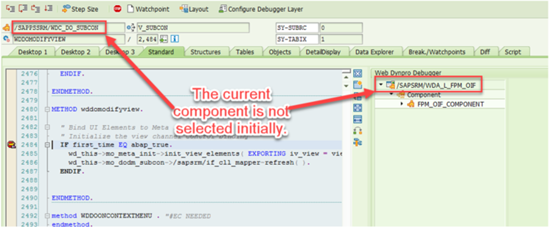
The Web Dynpro Debugger tool will open, allowing you access to the top level component for the application you’re testing. You may notice that the current component is not the component we were searching for (FPM_OIF_COMPONENT vs /SAPPSSRM/WDC_DO_SUBCON), and we will get to the correct component in a moment. For now though, let’s use the FPM_OIF_COMPONENT to point out some of the features of the Web Dynpro Tool.
An Overview of the Web Dynpro Debugger Tool
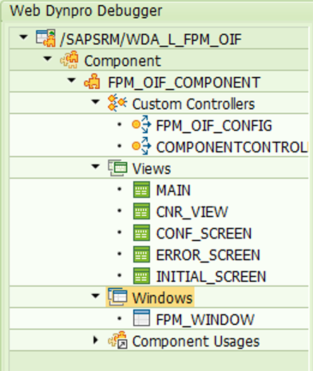
Expanding the FPM_OIF_COMPONENT subtree, we see four subcategories that we can explore, three of which are basic building blocks for any Web Dynpro component
– Custom Controllers
– Windows
– Views
The last of these subcategories is the Component Usages, which allows the user to navigate to the subcomponents of the current component:
Double clicking on an individual component controller, view, or window will allow you to view runtime data about that particular object. All three object types contain a tab for monitoring the Properties, Context, and Attributes of the object. let examine each one…
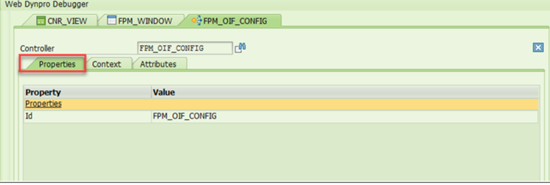
Component Controller and Properties Tab
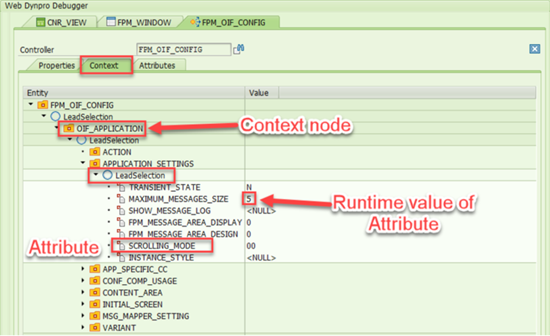
Component Controller and Context Tab
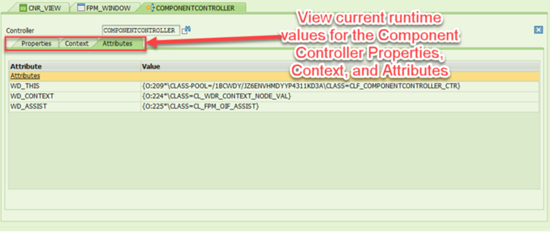
Component Controller and Attribute Tab
While the Component Controller is limited to these three tabs, the View and Window both have their own unique tabs in addition to these three…
Window and Window Structure Tab
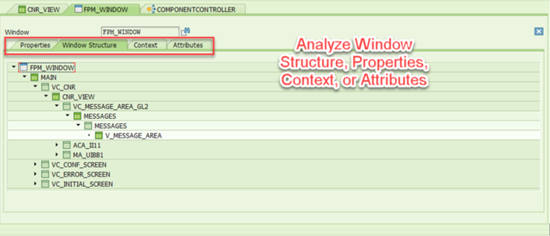
The Window Structure tab is the runtime representation of the “Window” tab when doing SE80 Web Dynpro development. This illustrates the hierarchy of Views and View Containers. Double clicking a View or View Container will display objects current property values.
View and Layout Tab
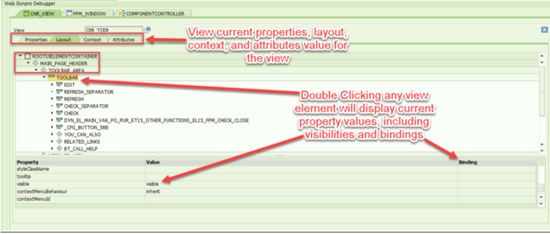
The View’s layout tab shows the exact same information it does within the SE80 Web Dynpro designer, but with the addition of runtime values. Double-clicking on any of these screen elements will allow you to View runtime property values for the object, including visibilities and current bindings.
This can be a very useful tool in situations where the screen elements are dynamically displayed on screen. For instance, if you have a case of a mysteriously disappearing button. This tool could be used to track down the moment the button’s visible attribute is changed, allowing you to find the source of the change.
Navigating Inside the Web Dynpro Debugger Tool
Getting to the Correct Component
Now that we have seen of some of the Web Dynpro Tool’s powerful features, let’s resume our original task of determining the source of our bill of materials sequence number. We currently have our Web Dynpro debugger Tool open, but it is currently referencing the wrong component… (see below)
What is often (and currently) the case is that, for large Web Dynpro applications, there will be multiple component usages that actually make up the program. One component will use another component, which in turn is using another component, leading to a long chain of these usages. This can be hard to navigate, and arriving at the component and view that your actually care about can end up being extremely difficult.
Luckily for us, SAP foresaw this problem and added a “Select Current Controller” feature. This feature allows immediate navigation to any controller that contains the code currently executing.
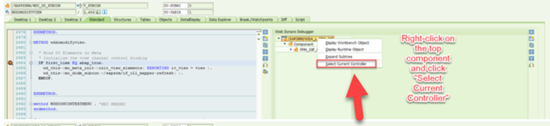
After clicking “Select Current Controller”, we are brought immediately to the correct controller.
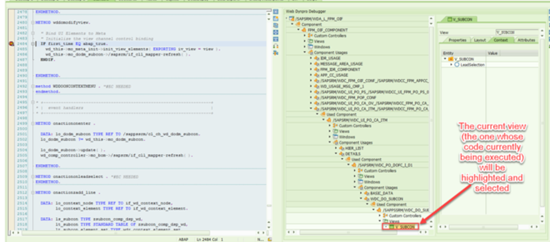
 Note that you MUST be within code for the current view for this to work, such as a controller method. (This is another reason it’s good to set a breakpoint at the WDDOMODIFYVIEW method.) If you are currently stopped inside a different view or not within controller code at all, you will then be taken to the incorrect view or the “Select Current Controller” option will just not appear.
Back to Our Example
Now that I am on the correct View Controller and context, I can step through the code and monitor context attribute. Once I see the context attribute change, I can continue navigating down the execution stack to find the moment our Context attribute changes.
For sake of brevity, I will fast forward to the point where I know the exact method responsible for updating my Context attribute. You can see that before executing this method, ZSUBCON_COMP has no arrow to the left (indicating it has no sub-items)…
After executing the code on line 47 however, we can watch as the ZSUBCON_COMP node populates and the corresponding attributes take on their values…
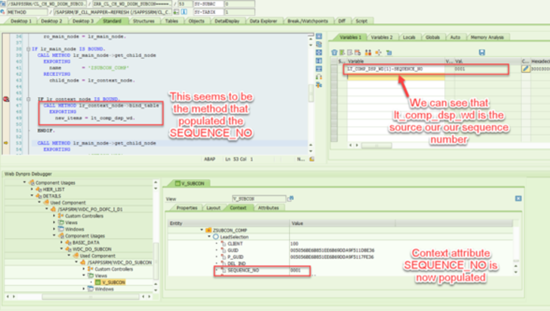
From this, we can reasonably deduce that this method call is responsible for populating the SEQUENCE_NO Context attribute, and consequently, the TextView value bound to this same attribute. From this point, we can track the table parameter used in the method (lt_comp_dsp_wd) in normal ABAP fashion to find the source of information.
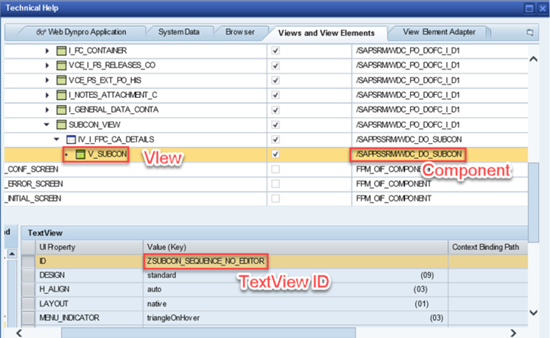
As promised…..Finding The Technical Information for Current Web Dynpro Application
The ability to find technical information for a screen element you’re curious about is simple thanks to a built in Web Dynpro feature. Simply right click on the element in question, select “Technical Help”, and a new window will appear showing tabs worth of information relating to that element.
For purposes of using the Web Dynpro debugger Tool, you will want to know the element ID, current view, and current component. All three of these details can be found on the “Views and View Elements” tab…
Summary
The Web Dynpro tool is very helpful for analyzing context nodes and the respective data filled at runtime in complex applications. It has access to all of the data you would expect to access at run-time while keeping the tool simple enough for even a Web Dynpro novice to understand and use effectively. It is a tool that, once you get the hang of it, I am sure you will never do without when working with Web Dynpro applications.