 Anthony Cecchini is the President of Information Technology Partners (ITP), an SAP consulting company headquartered in Pennsylvania. ITP offers comprehensive planning, resource allocation, implementation, upgrade, and training assistance to companies. Anthony has over 20 years of experience in SAP business process analysis and SAP systems integration. His areas of expertise include SAP NetWeaver integration; ALE development; RFC, BAPI, IDoc, Dialog, and Web Dynpro development; and customized Workflow development. You can reach him at [email protected].
Running Traces in the ABAP Debugger
I was recently on a Skype learning session at a client where the topic was “Advanced Debugging Techniques”. The developer delivering the live training was showing examples of using Debugger Scripting. For those that need a refresher on what that is, check out our blog post, Fast, and Easy SAP ABAP Debugger Scripting.
While explaining how to execute a statement trace for an SAP ABAP Program using the delivered script “RSTPDA_SCRIPT_STATEMENT_TRACE”, one of our new ABAP developers asked if there was a way to trace SQL, similar to running ST05. And this Blog post was born…
The Answer is a resounding YES! Not only can you trace SQL, but you can trace buffers, RFC’s, Enqueues, and the Classic SE30 ABAP Trace.
Lets run an example using the ST05 Performace trace. If you need a refresher on what this trace is, and how to interpret it take a look at our blog post ABAP Database SQL Analysis Using The Performance Trace parts one and two. Please note you also require ECC SAP_ABA release 702.
Running ST05 in the ABAP Debugger
First, we need to be debugging something with SQL. So for this blog post I am going to use a liitle program ztony_demo_traces. Here is the code below:
REPORT ztony_demo_traces.

TABLES: vbak.

SELECT *
FROM vbak
INTO vbak.
ENDSELECT.

BREAK-POINT.

SELECT SINGLE *
FROM vbak
INTO vbak
WHERE vbeln = '0000004969'.

BREAK-POINT.
OK, let’s put a BREAK_POINT on the first select and run the program. The debugger should pop up and land you in the Standard Tab.
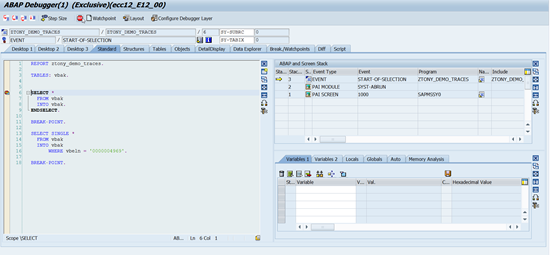
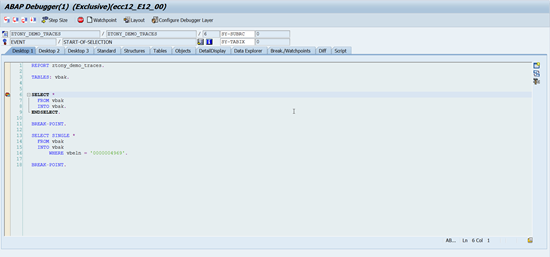
Let’s Switch over to the Desktop 1 Tab. and delete any open tools other than the Source Code Tool. Your Desktop should look like this:
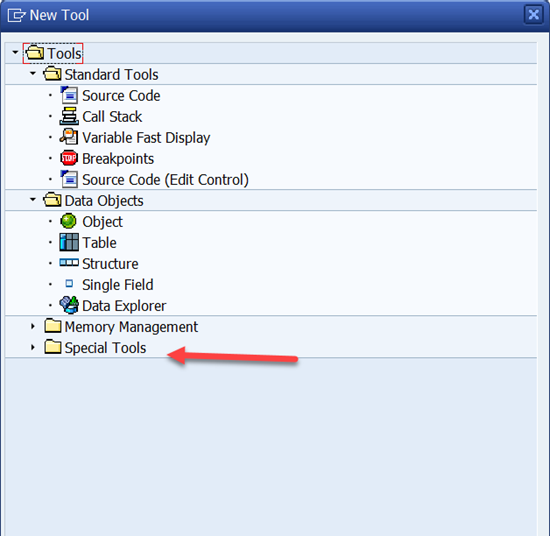
OK great — now look way over to the upper right corner. You should see the New Tool Icon ![]() . Click this and you should see the following pop-up.
. Click this and you should see the following pop-up.
Expand the Special Tools Node and you will see Trace (SE30/ST05) as an option you can double-click and add to your current Desktop 1.
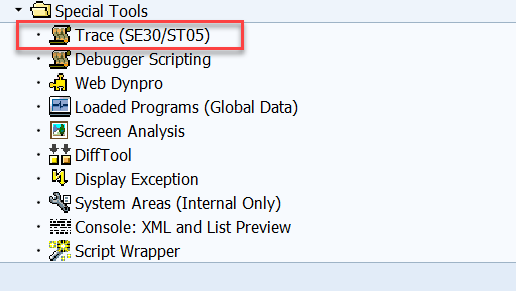
Please double-click. Your Desktop should now look something like this…
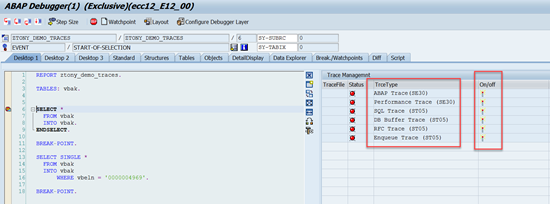
OK, let us stop here for a minute. On the right-hand side is the “New” tool we just added. You can see we have many other traces we can use besides the ST05 Trace. We have the Classic ABAP Trace (SE30), we have a Buffer Trace, an RFC Trace, and even an Enqueue Trace for locking issues. We will use the ST05 Trace in this post.
Turning the ST05 Trace on While Debugging
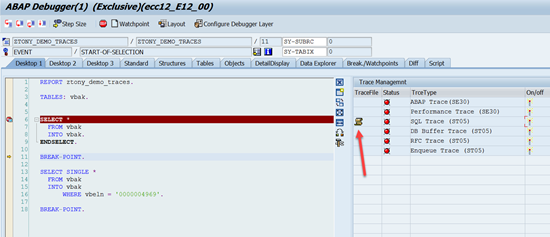
We turn the trace on or off by using the Activate Icon ![]() . OK, please double-click and activate the ST05 performance Trace. Then go ahead and execute the OPEN SQL to SELECT VBAK. Please make note that this SELECT DOES NOT HAVE A WHERE CLAUSE! This was done purposefully as to force the Optimizer to select an execution path of a FULL TABLESPACE SCAN. OK, when the SELECT VBAK is finished and hits our Hard BREAK-POINT, double-click to deactivate the trace and your Desktop should look like this:
. OK, please double-click and activate the ST05 performance Trace. Then go ahead and execute the OPEN SQL to SELECT VBAK. Please make note that this SELECT DOES NOT HAVE A WHERE CLAUSE! This was done purposefully as to force the Optimizer to select an execution path of a FULL TABLESPACE SCAN. OK, when the SELECT VBAK is finished and hits our Hard BREAK-POINT, double-click to deactivate the trace and your Desktop should look like this:
Viewing the ST05 Trace Results
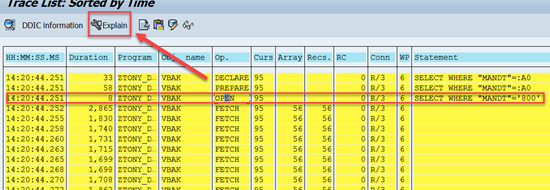
You should now see an ![]() icon in the column TraceFile of the Trace Management Tool. This is the result of tracing the SELECT VBAK. Please double-click this icon and you will immediately recognize the ST05 Tool and its screens. We want to use the EXPLAIN capability of ST05 to see the EXECUTION PATH chosen by the Optimizer. So, position your cursor on the OPEN line of the log and hit the EXPLAIN button at the top on the Application ToolBar.
icon in the column TraceFile of the Trace Management Tool. This is the result of tracing the SELECT VBAK. Please double-click this icon and you will immediately recognize the ST05 Tool and its screens. We want to use the EXPLAIN capability of ST05 to see the EXECUTION PATH chosen by the Optimizer. So, position your cursor on the OPEN line of the log and hit the EXPLAIN button at the top on the Application ToolBar.
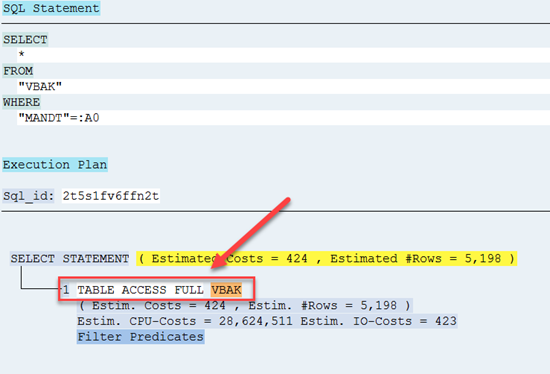
You will see the results of the EXPLAIN, and most importantly you will see the Optimizer has chosen an Execution path of TABLE ACCESS FULL, which is a complete scan of the table. very inefficient, and something we as developers should never do.
We still have one more SELECT VBAK OPEN SQL Statement we could trace. This shoud be very efficnet as we are using the primary key in a WHERE Clause. I’ll skip most of the steps, but when you view the EXPLAIN, it should look like this:
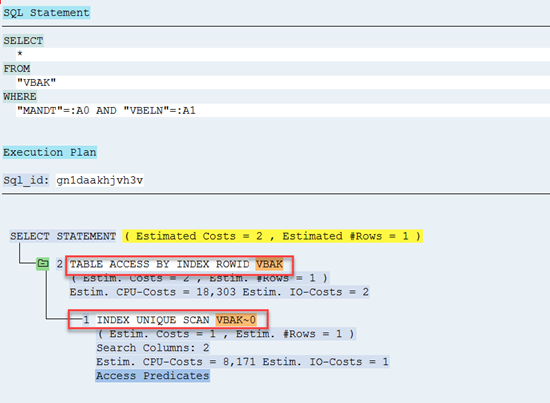
A couple of points — first you can see we are using the INDEX VBAK~0. because we are using this index, we can do a UNIQUE scan based on the VBELN we passed in the WHERE clause. Also note, the cost has significantly decreased from 424 to 2, and this was for only around 5K of rows.
Summary
You already know how easy it is to customize your debugger desktops by adding (or removing) any of the Tools, and how easy it is to arrange them on the desktops from viewing our Debugger Post The New ABAP Debugger – Part 2 . Well, now you can add the Trace Tool to your debugging arsenal!